

Elastic APM: A Walkthrough
How to improve your overall software performance by implementing Elastic APM


What is APM?
Application performance management, or APM, is the act of managing the overall performance of software applications to monitor availability, transaction times, and performance issues that could potentially impact the user experience.
This really helps in finding the lagging point, slow performing point, a point which is using High CPU or even a point where memory can be found. Finding these not so well performing loopholes are also useful in managing the cost of the application as well as improving its performance.
It provides all the three things:
Metrics - metrics are data points that directly reveal the performance of a DevOps software development pipeline and help quickly identify and remove any bottlenecks in the process.
Traces - This pinpoints where failures occur and what causes suboptimal performance.
Logs - This provides end-to-end visibility into all stages of software delivery.
Just to clarify APM is a bit different from Observability. I once found a very good explanation therefore quoting that here - Application performance monitoring involves tracking system metrics and producing visualizations that are designed to provide DevOps teams with important data regarding system performance. Observability, on the other hand, is really more of an attribute than a process. A system is considered observable if its state can be easily determined without further implementations.
Some of the APMs that I have come across are:
Here in this article we will have a basic walkthrough of the Elastic APM and how it monitors a basic Node.js app.
For this I have setup a simple Amazon EC2(Amazon Linux 2 machine). To find how to setup these, check my article on the same. This will help with the basic system setup along with its
nginx.
Elastic APM
According to the official docs, Elastic APM is an application performance monitoring system built on top of Elastic Stack. It allows you to monitor software services and applications in real-time by collecting detailed performance information on response time for incoming requests, database queries, calls to caches, external HTTP requests, and more. This makes it easy to pinpoint and fix performance problems quickly.
Install ELK Stack
Follow this download link to install ELK stack. After successfully downloading, move on to Observability -> APM -> Services. You will be presented with the following screen:
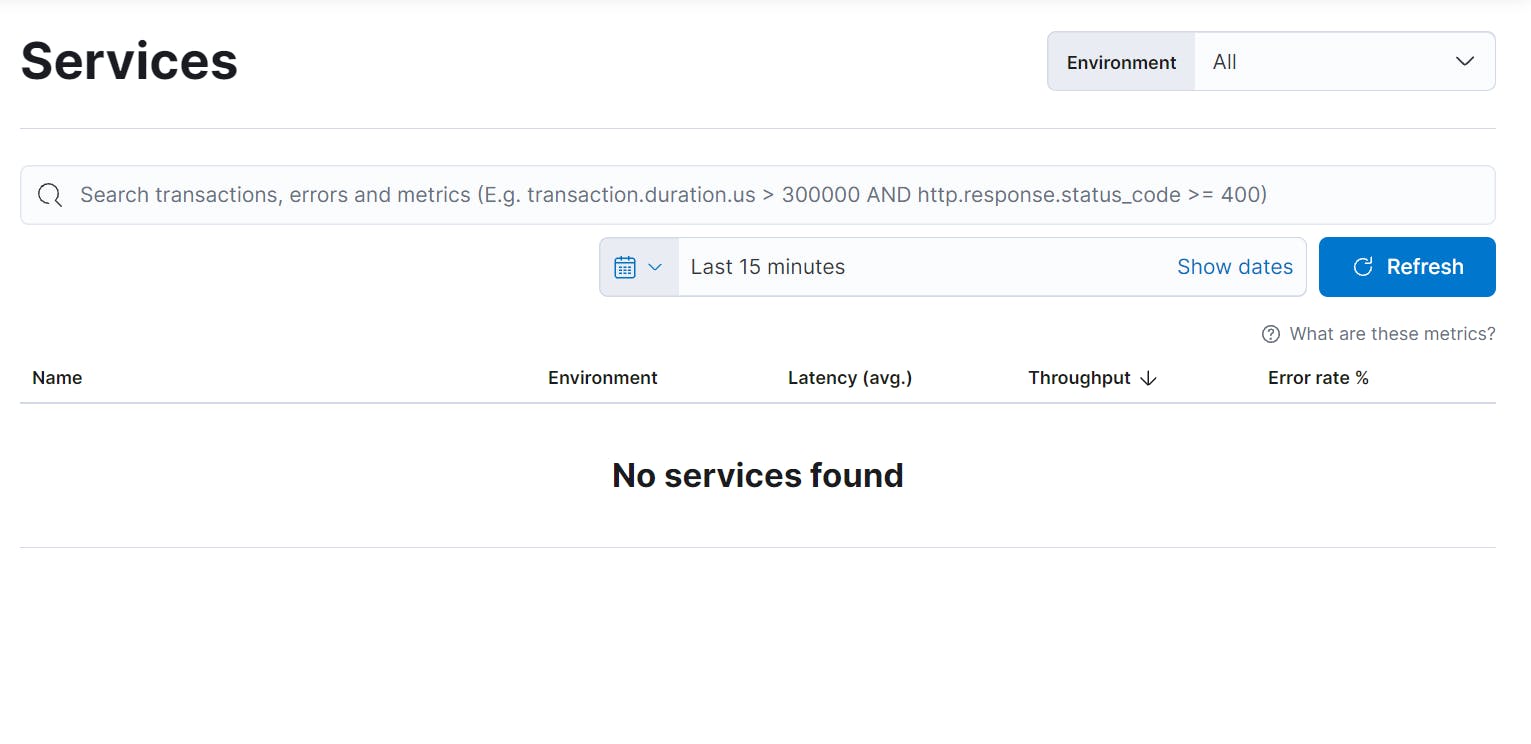
No services were used as we have not setup any thing as of now.
Create the node app.
- Here we create a basic Node.js app with all the required CRUD Operations.. Lets initialize the same:
npm init npm i nodemon npm i express - For this, I have used a MariaDB server setup with a database called
test_db, aPersonstable inside it with the following contents:
+------+---------+
| ID   | Name    |
+------+---------+
|   10 | Messi   |
|    7 | Ronaldo |
|    9 | Suarez  |
+------+---------+
- Add the following code to
index.jsfile to go forward:
const express = require('express')
const app = express()
const port = 3000
var mysql = require('mysql')

app.use(express.json());
app.use(express.urlencoded({ extended: true }));

// Iniatilizing mysql connection
var con = mysql.createConnection({
        host: "localhost",
        user: "root",
        password: "password",
        database: "test_db"
});

con.connect(function(err) {
       if (err) throw err;
       else console.log("Connected")
});

// Get all
app.get('/', (req, res) => {
       con.query("Select * From Persons", function(err,rows){
                if (err) throw err;
                else res.send(rows)
        })
})

// Get by id
app.get('/:id', (req, res) => {
       let id = req.params.id;
       con.query("Select * From Persons Where ID = " +id , function(err,rows){
                if (err) throw err;
                else res.send(rows)
       })
})

// Post
app.post('/', (req, res, next) => {
       var data = req.body;
       var id = data.id;
       var name = data.name;
       var values = [
             [id,name]
        ]
       con.query("Insert Into Persons (ID,Name) Values ?",[values],function(err,result){
               if (err) throw err;
               else console.log("Inserted")
       })
})

// Delete
app.delete('/:id', (req, res) => {
       var id = req.params.id;
       con.query("DELETE From Persons Where ID = " +id , function (err, results){
               if (err) throw err;
               else console.log("Deleted")
        })
})

//Update
app.post('/update/:id', (req, res, next) => {
        var id = req.params.id;
        var data = req.body;
        var name = data.name;
        var values = [
               [name]
        ]
        con.query("Update Persons Set Name = ? Where ID = "+id,
        [values],function(err,result){
                 if (err) throw err;
                 else console.log("Updated")
        })
})

app.listen(port, () => {
        console.log(`Example app listening at http://localhost:${port}`)
})
- Run the code by adding the following snippet into your console:
node index.js
- Expected Output -
Example app listening at http://localhost:3000
Connected
- Now test the above operations to complete the setup.
Integrating the above with Elastic APM
- Install the dependency by entering the following snippet in your console:
npm i elastic-apm-node --save
- Add the following on the top of the first file that will be loaded (In this case the index.js file):
//APM config
const apm = require('elastic-apm-node').start({
      serviceName: 'test',//Override service name from package.json
      //secretToken: ''               //Use if APM Server requires a token
      //apiKey: ''                    // Use if APM Server uses API keys for authentication,
      serverUrl: 'http://<serverIP>:8200',// Set custom APM Server URL
})
//config ends
serverURL may change as per the config you have followed
- Run the code as shown below:
node index.js
- Check the APM dashboard now and you should have the following results:
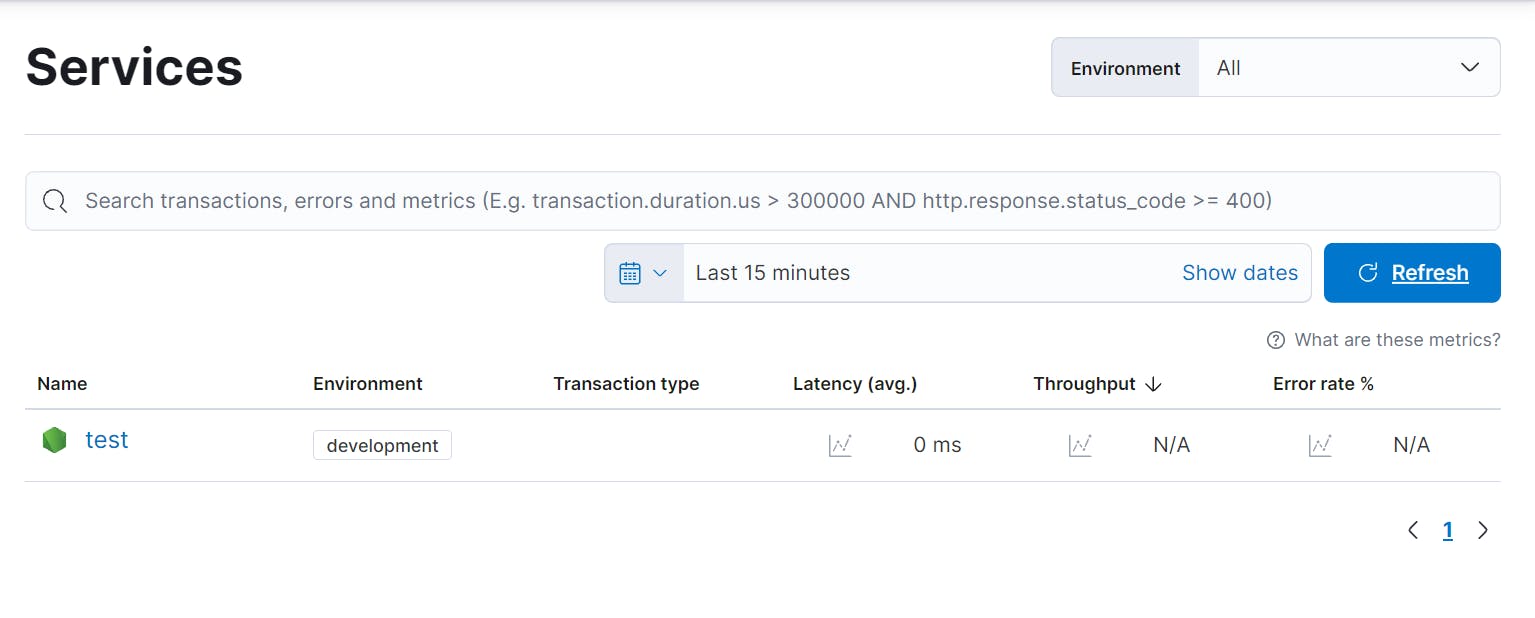
Explore and understanding the APM dashboard.
The APM dashboard will give information of all the things running in and around the app. The latency, throughput, queries/transaction carried out, dependencies, CPU and memory usage of this app on the instance. On further moving inside each query one can find trace samples, metrics and errors if any during an action.
For this I have used
GET /,GET /:id,DELETE /:id(with unavailable ID).First after executing
GET /,GET /:id, the following data was visible on the dashboard.
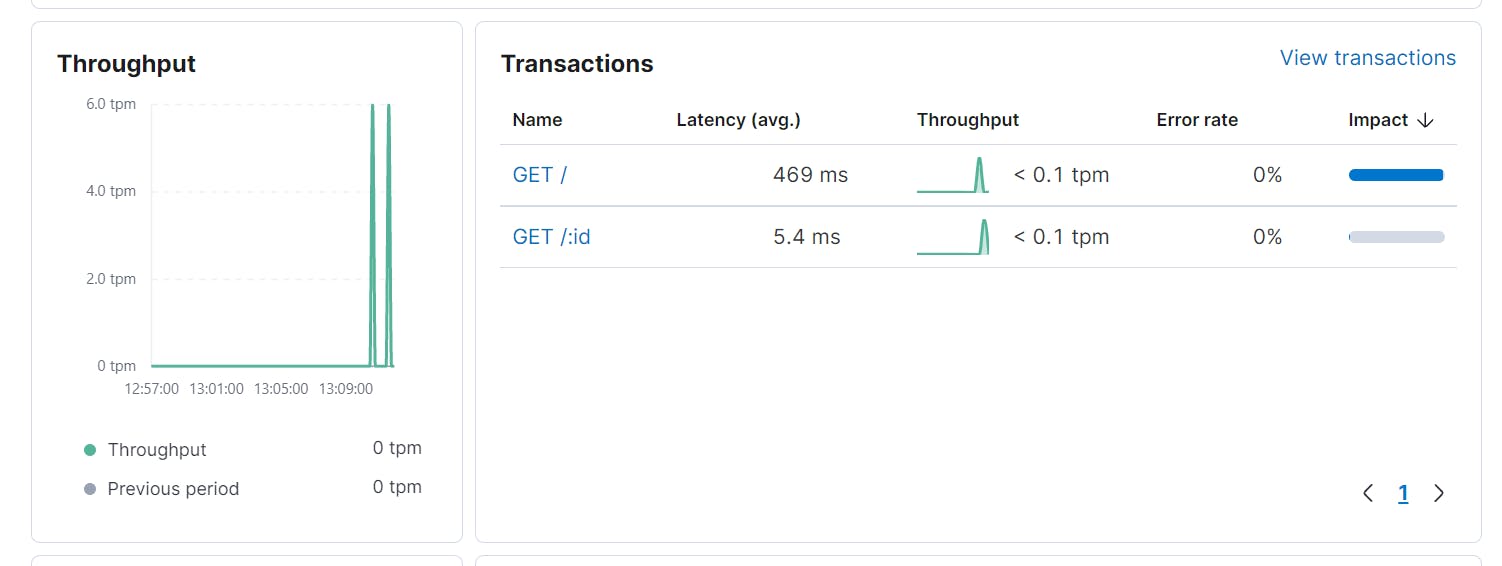
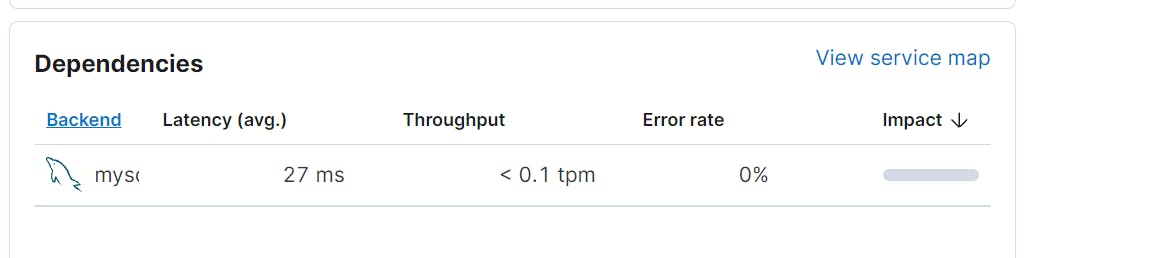
- This shows all the transactions run as of now along with each transaction's tpm (throughput per minute). Some other things that appeared on the main service dashboard were the backend dependencies used along with the system level metrics of the EC2 instance. Refer to the images given below:
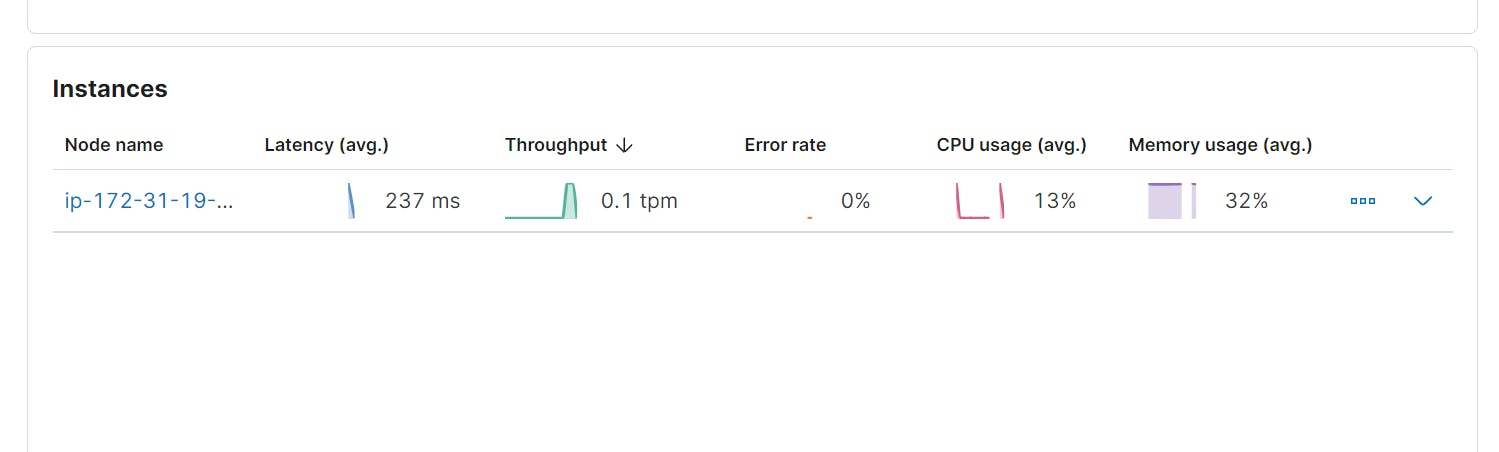
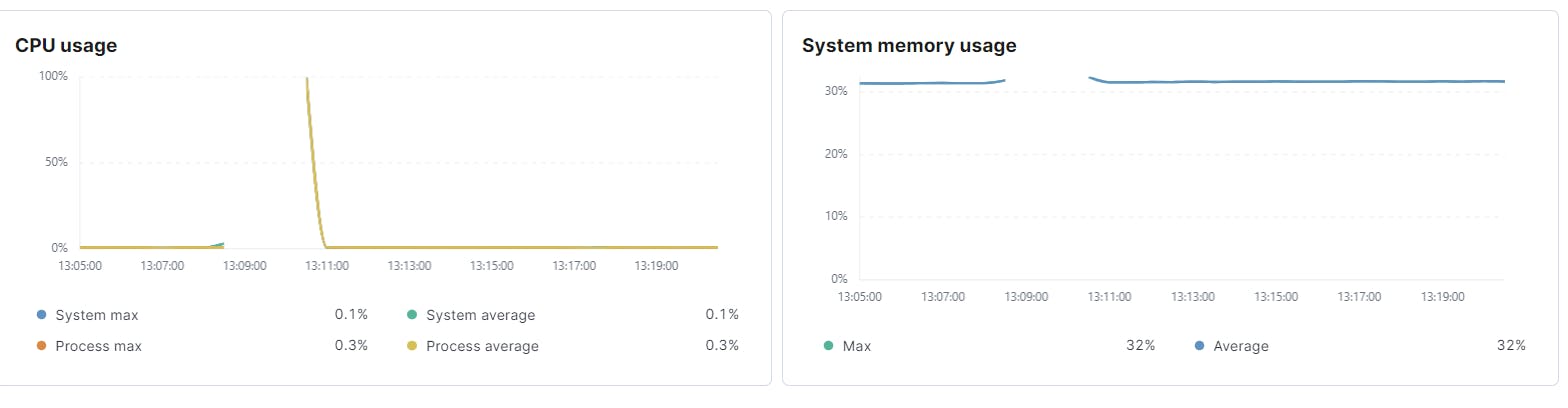
Clicking on the instances will get the metrics required. Here's what the result should look like:
Let us now click on one of the transactions to find out what the dashboard presents. Going ahead with the
GET /:id, most of the details were the same as that of the main dashboard. The additional info that was available here was theTrace Samples. Refer to the image given below:
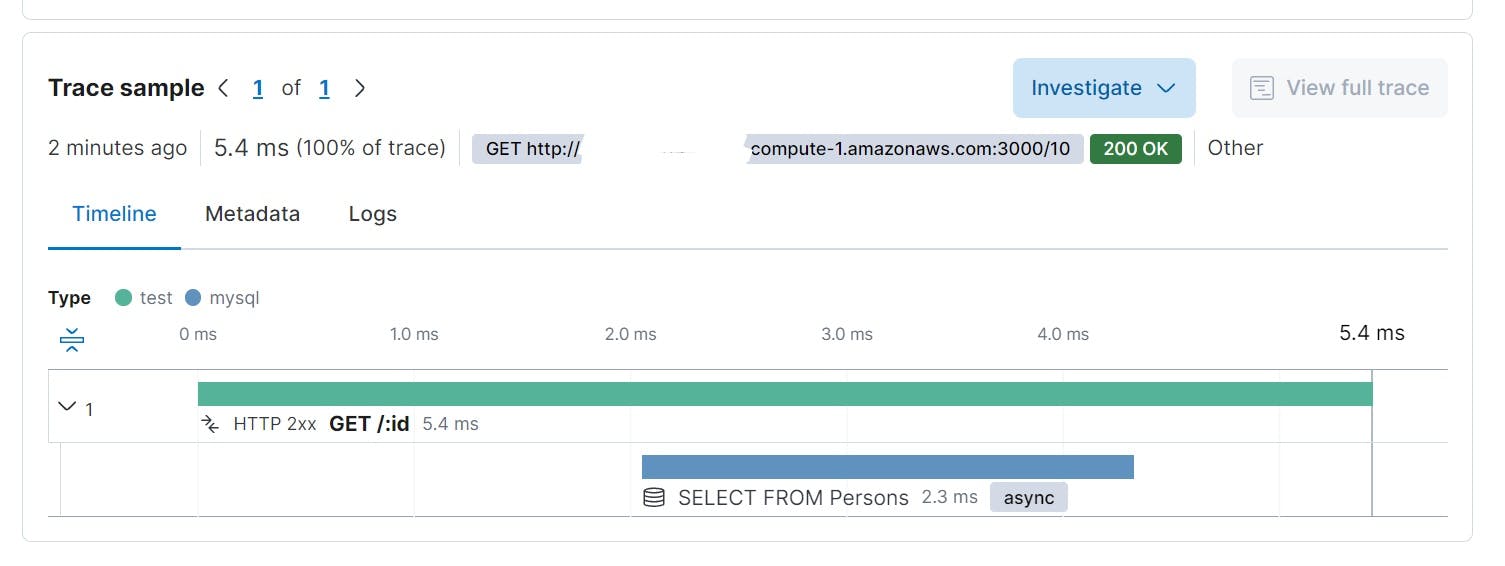
- This gives a deeper insight on the queries that ran in the backend to produce results. This is showing only one however if there is code that is complex, there are multiple queries that will run in each transaction and all of them will be visible here. Refer to the image given below:
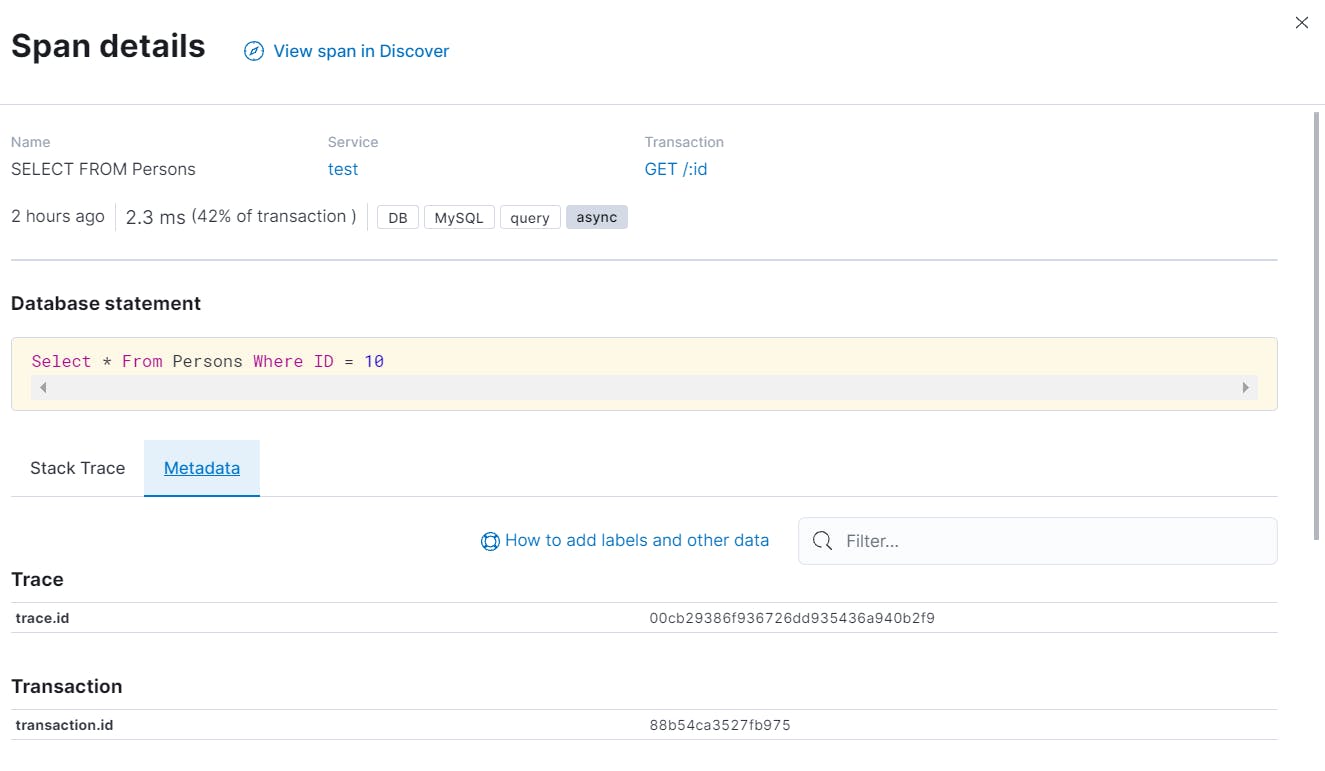
Want to check further inside each query? Go ahead and click it and scroll down the Metadata to access more info on the query.
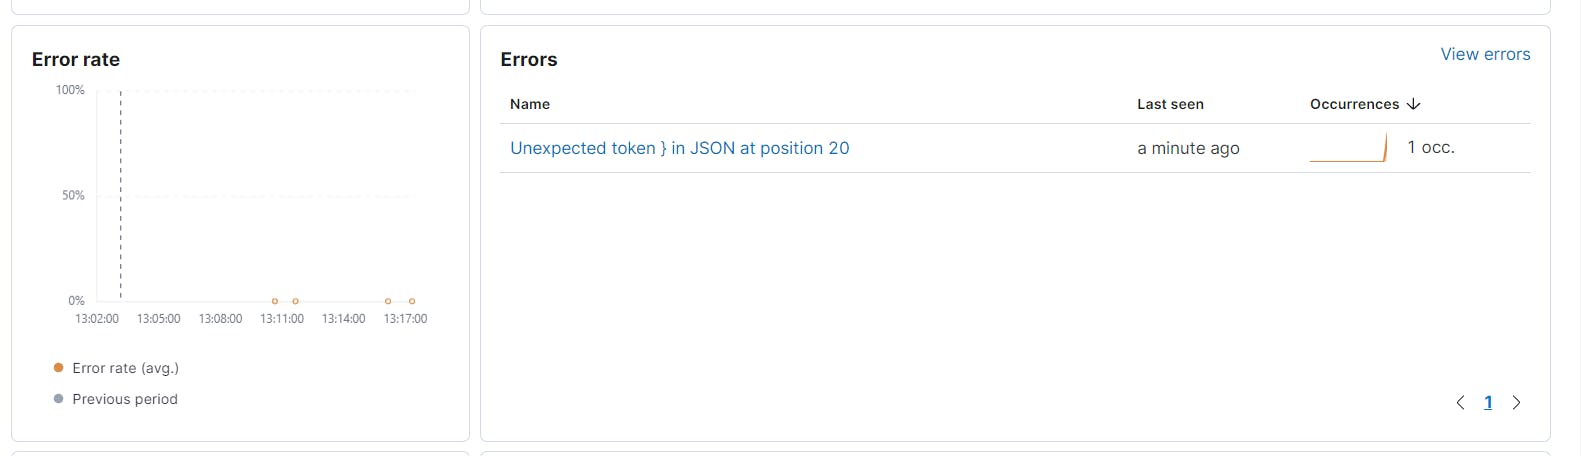
- Now let's see how APM monitors any errors. For this I have used
DELETE /:id. (with the unavailable ID). Here's an overview of the error as shown in the main dashboard:
- On exploring the
Transaction, a simpleTrace Sampleas seen earlier during the GET query: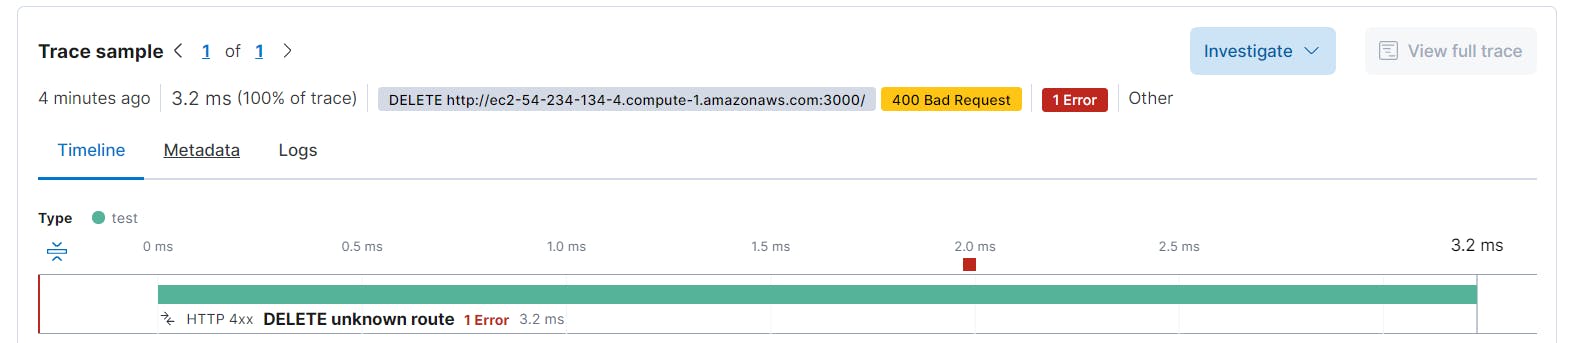
- Under the
Errorstab, we can see a detailed info the error that has come up as shown: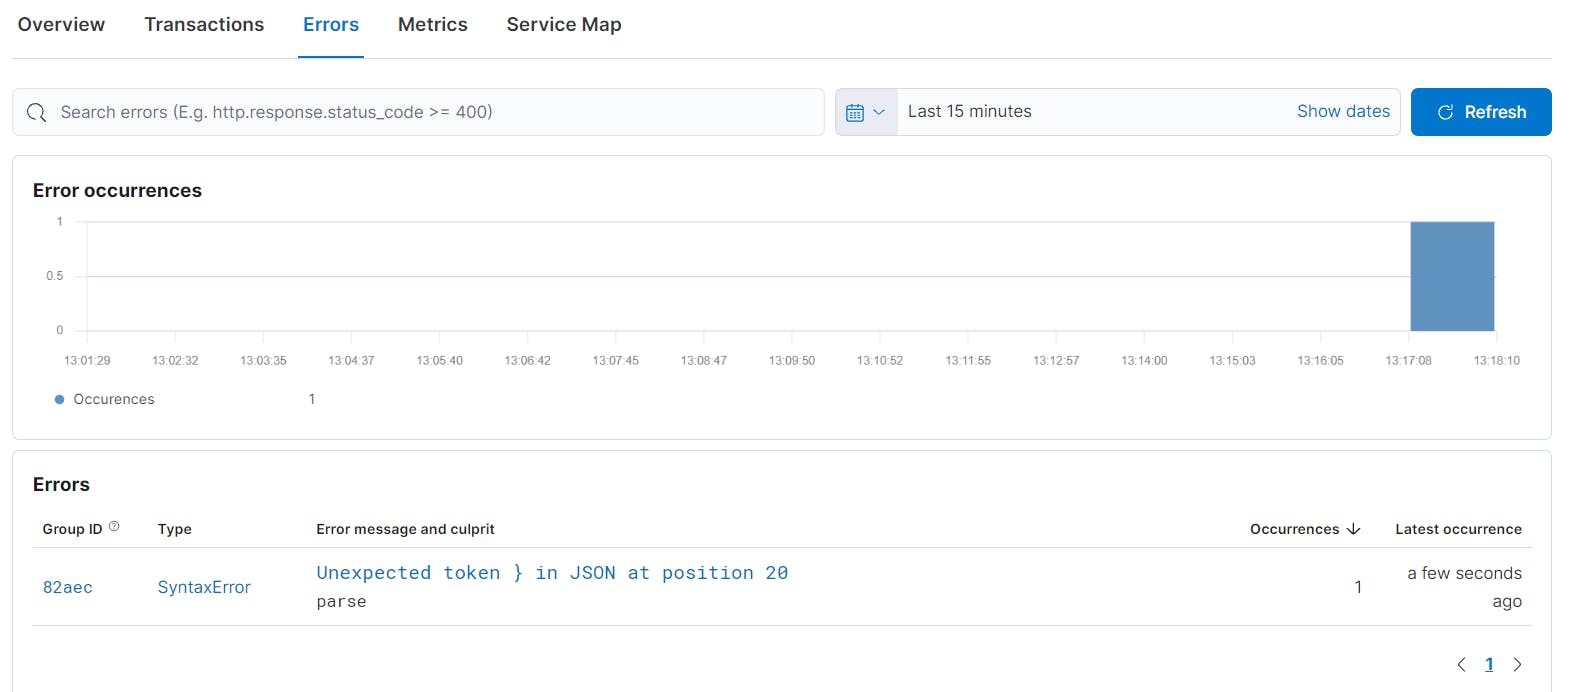
- On clicking the error, one finds the
Stack traceof the error as shown in the picture below: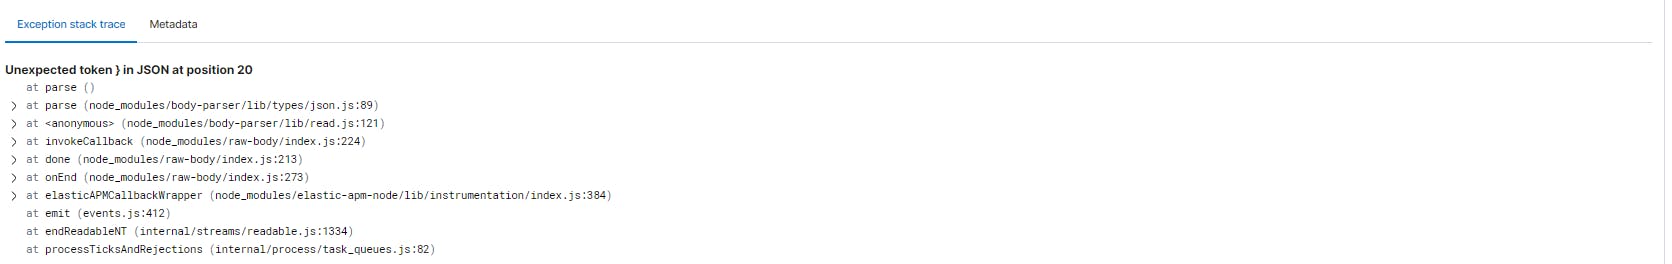
The latency of each query is also important to find where the code needs optimization which indicates whether the queries are returning a response at a faster rate. This is a very important point here and not to be neglected as effective cost saving can be implemented.
Conclusion
Elastic APM is a really good tool to understand the entire performance any application. Here are some benefits of using an Elastic APM:
Elastic APM also automatically collects unhandled errors and exceptions. Errors are grouped based primarily on the
stacktraceso that you can identify new errors as they appear and keep an eye on how many times specific errors happen.Metrics indicates another vital source of information when debugging production systems.
Elastic APM agents automatically pick up basic host-level metrics and agent-specific metrics, like JVM metrics in the Java Agent, and Go runtime metrics in the Go Agent alongside many other such agents.
Hope this article interests you in giving it a try. Also looking ahead to writing more content on some more APMs I have explored. Thank you !!