Implementing UI Profiling On Flutter Applications
A brief how-to on implementing UI profiling on Flutter using development tools for a well-functioning application
Nowadays, mobile applications are more user-friendly and work faster when either retrieving or requesting services from the internet. Successful mobile applications have an amazing user interface that engages end-users. But, what if the app is not smoothly? That's where Flutter UI profiling comes to the rescue by identifying the root cause a bad user experience and weighing the tradeoffs. Before getting started with the profiling of an app, let's understand a few basic terminologies which are required for UI profiling.
1. Jank
What is jank? Ideally, an app would load quickly, look good and run smoothly. Jank is referred to the unreliable code which results in a user experiencing stuttering or choppiness when scrolling, transitioning or playing animations
When does it occur? Most devices are refreshed 60 times/second i.e each frame nearly gets 16.67 milliseconds to do calculations and render new frames. Jank is simply the result of the app screen not being able to keep up with the refresh rate of the display and such frames are ideally dropped. Flutter aims to provide 60 frames per second (fps) performance along with a performance of 120 fps on devices capable of 120Hz updates. We have to figure out what part of the code is causing frames to render for too long and come up with a solution to avoid
2. Threads used by Flutter
What is a thread? Any program which is under execution is a process while a thread is the path of execution within a process. A process can contain multiple threads. Refer to the diagram given below to answer this better before we get around to looking at a few types of commonly used threads on Flutter:
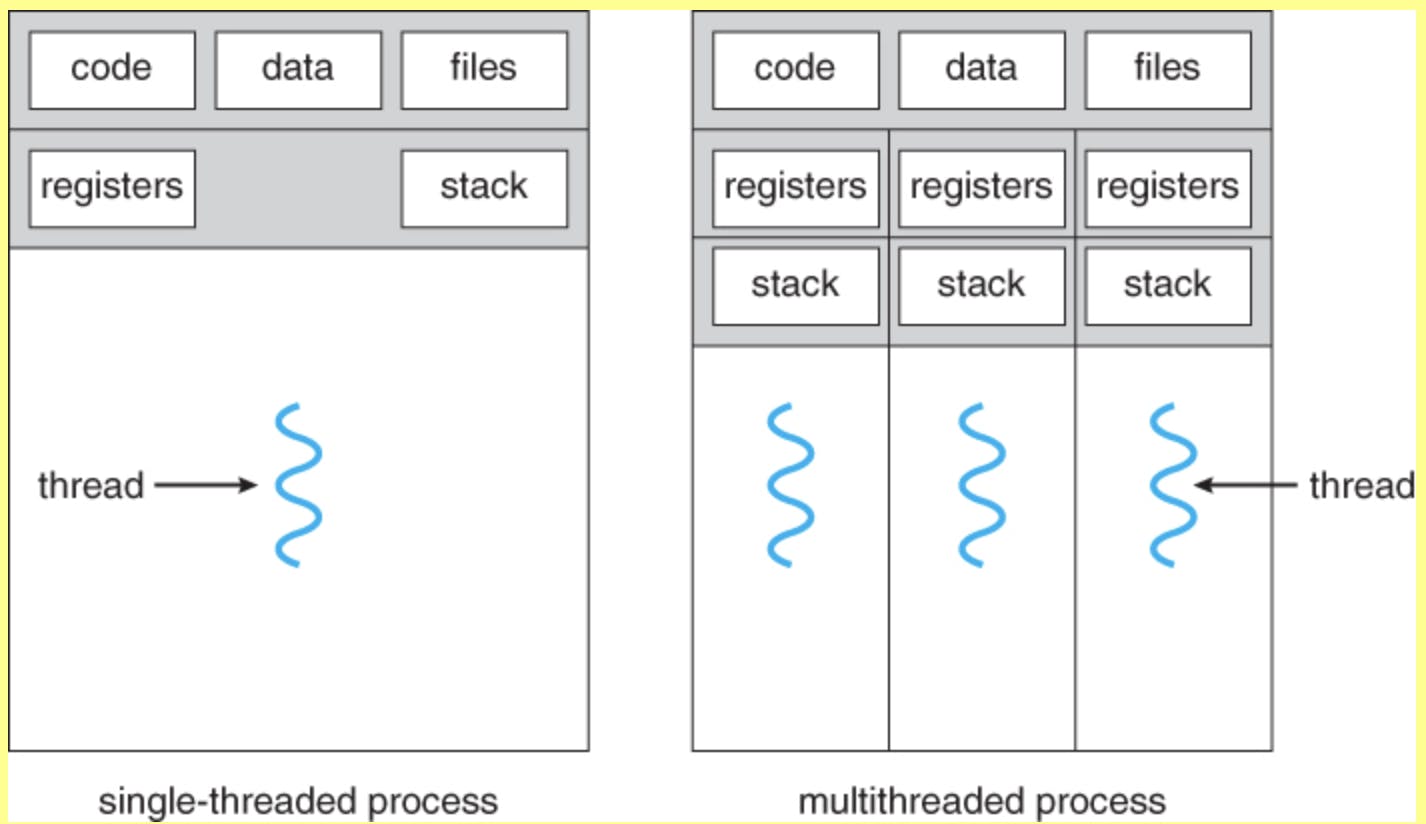
- Platform Thread: The platform thread is the main thread where the plugin code is run.
- UI thread: Dart has a single-threaded execution model which produces a code required by Dart. UI threads executes the code from your application as well as from the Flutter framework using Dart VM. Once the code execution is completed, a layer tree which is a lightweight object containing device-agnostic painting commands is created and sent to the raster thread to render the UI. We should take utmost care not to block this thread which will affect the functioning of the app. But, what if you need strenuous work to be performed on the UI thread? Dart offers a feature called Isolates where you can run your Dart code on another thread. Isolates communicates with the UI thread by utilizing Ports and Messages to convey messages. You will also have the added benefit of making use of futures, streams and background for asynchronous work. A UI thread which is driven by the event loop takes an item from the event queue and handles it recurrently for as long as the queue has items. The items in the queue might represent user input, file I/O notifications, timers and more.

The Dart app starts execution when the main isolate(UI thread) executes the app’s main() function. After this step, the main isolate’s thread begins to handle any items on the app’s event queue. Refer to the diagram below to understand this concept better
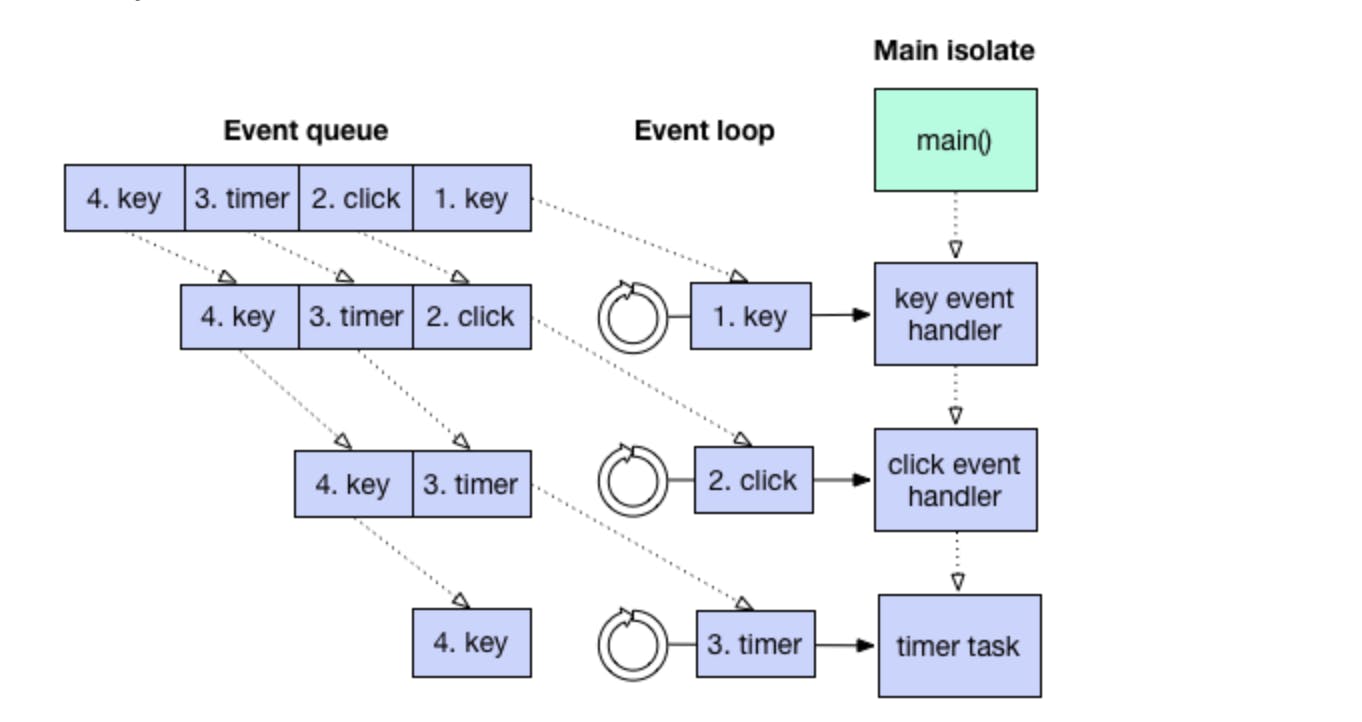
- Raster thread (previously known as the GPU thread): Skia, the graphics library, runs on a model based on the raster thread. It mainly functions by calling the layer tree and displaying it by communicating to the GPU.
- I/O thread: This thread performs expensive tasks (mostly I/O) that would otherwise block the UI or raster threads.
3. Performance overlay
The performance overlay displays statistics in two graphs that show where the time is being spent in your application. In the image given below, the performance overlay shows the raster thread(top) and the UI thread(bottom) while the vertical green bars represent the current frame.
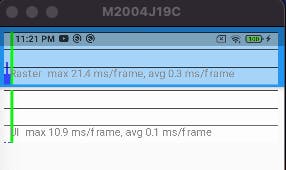
How to use performance overlay? (In reference to the image)
The top graph (marked “GPU”) shows the time spent by the raster thread while the bottom one graph shows the time spent by the UI thread.
The white lines across the graphs show 16ms increments along the vertical axis; if the graph ever goes over one of these lines, it means that you are running at less than 60Hz.
The horizontal axis represents frames and the graph is only updated when your application paints.
Each frame should be created and displayed in approx 16ms. If a red vertical bar appears in the UI graph, then the Dart code is expensive and if it appears in the GPU graph, the scene is too complicated to render quickly. This is an indicator that you need to find out what the lag is.
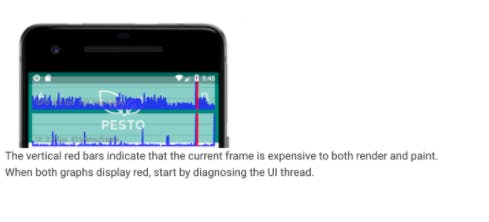
You can toggle through the options of the display showing for performance overlay using the following methods:
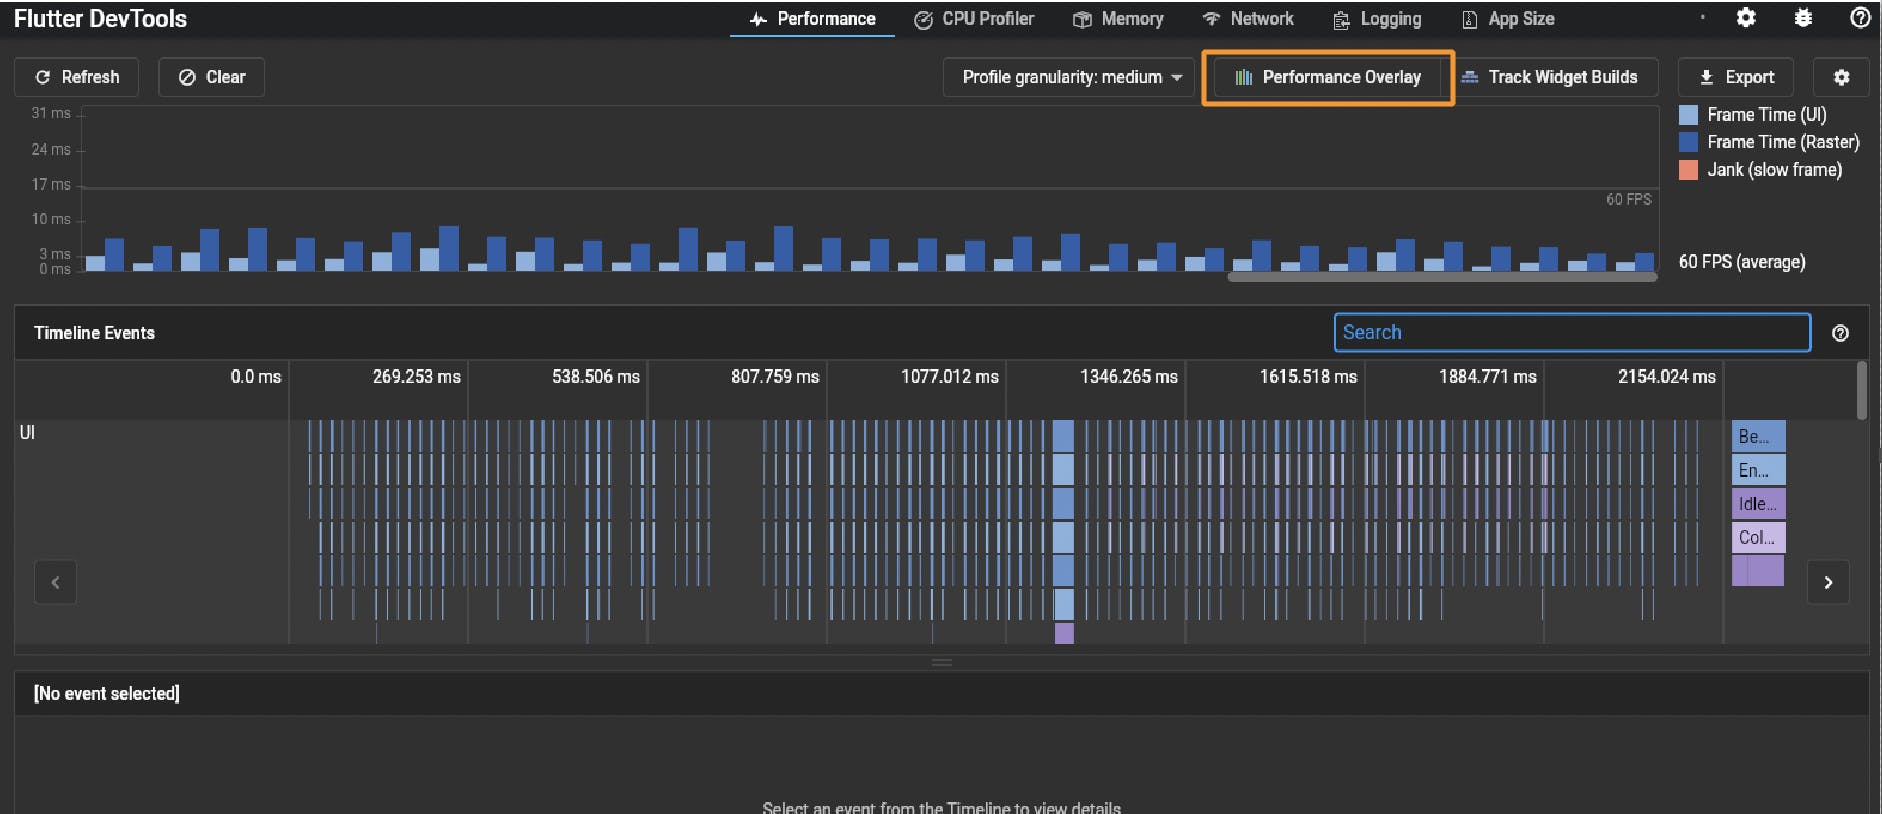
1. Flutter Inspector: Clicking the performance overlay button by clicking on the performance overlay button on Flutter Inspector.
2. Command line: Select the "P" key from the command line.
3. Programmatically: You can also run a code for doing this by adding showPerformanceOverlay: true in the MaterialApp widget. Refer to the process given below:
class Home extends StatelessWidget {
  const Home({Key key}) : super(key: key);

  @override
  Widget build(BuildContext context) {
    return MaterialApp(
      showPerformanceOverlay: true,
      home: FirstScreen(),
    );
  }
}
4. Flutter frames chart
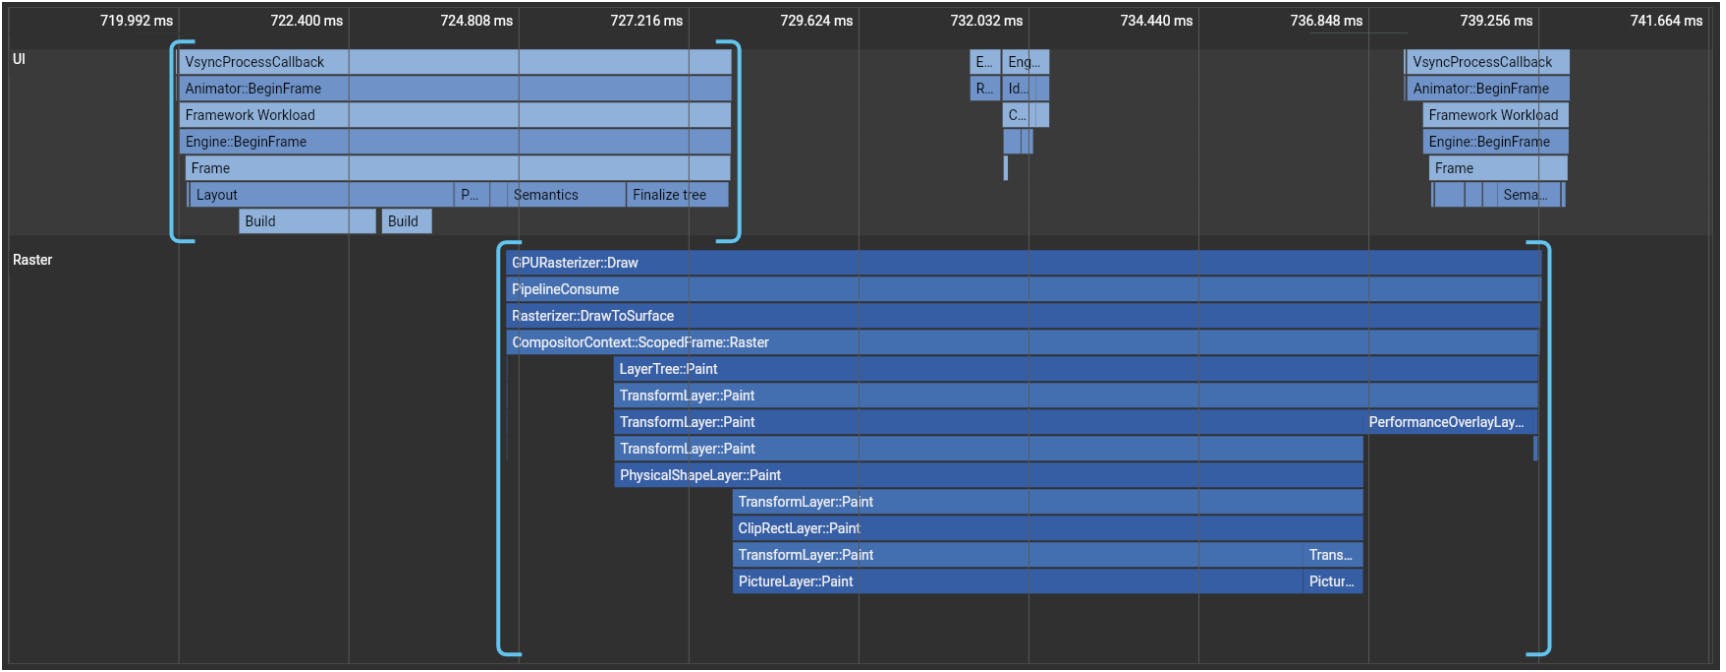
When an application is run, Flutter frames are generated and the information is displayed in the frames chart. A single Flutter frame is represented by a bar set which is color-coded to highlight and distinguish the different portions of work done by the UI thread and raster thread individually.

Selecting a bar from the chart shown above centers the frame chart given below for timeline events corresponding to the selected Flutter frame. The events are highlighted with blue brackets.
5. Timeline events chart
The timeline events chart in Flutter shows all the event tracing details of your application. The Flutter framework emits timeline events as it works to build frames, draw scenes and track other activities such as HTTP traffic. These events show up in the timeline as you can see in the picture given below:
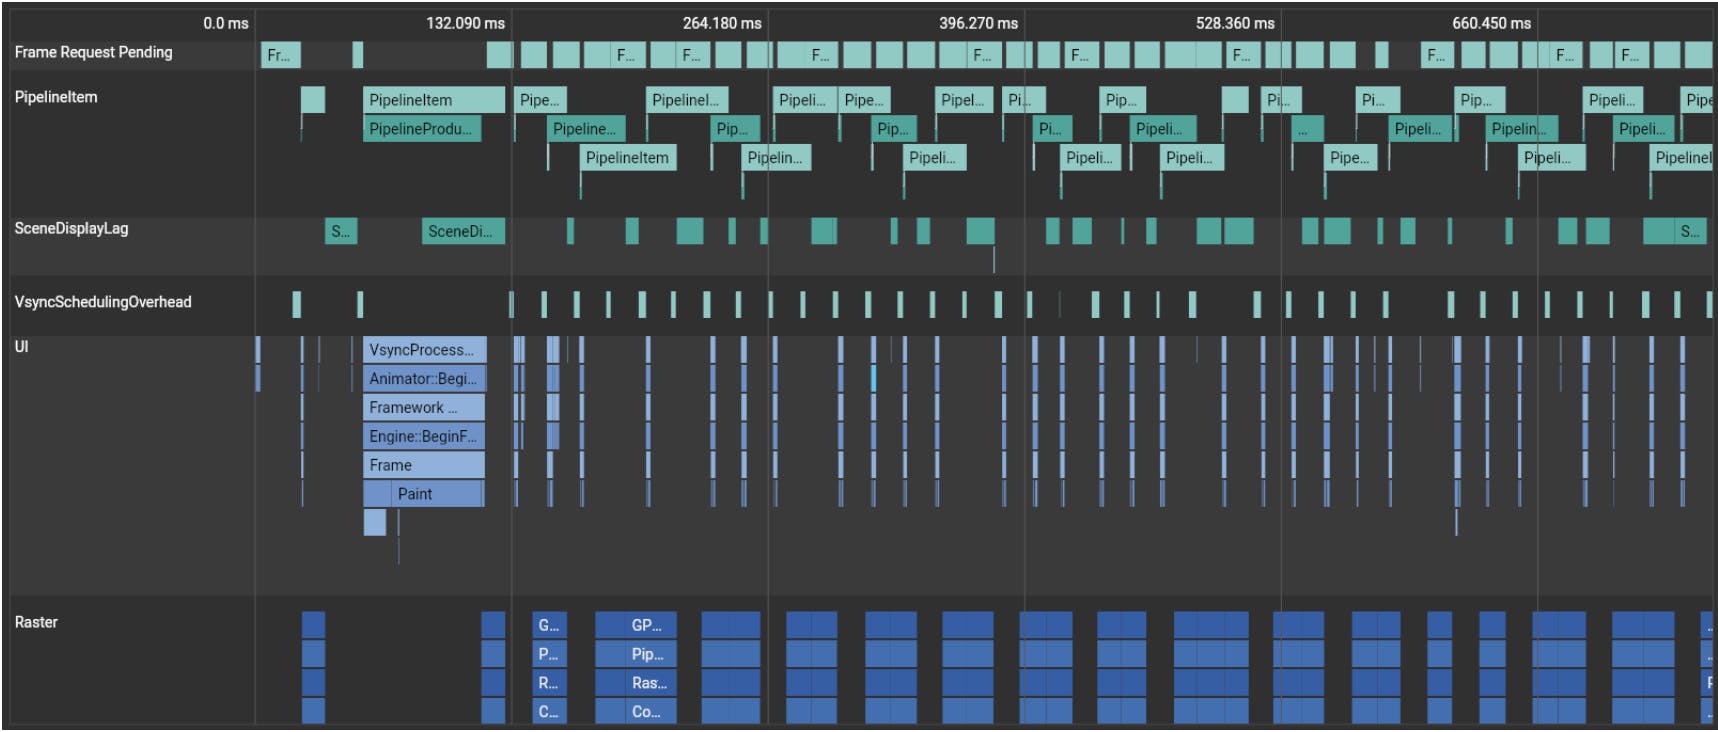
The frame chart supports zooming and panning. Let's explore how:
To zoom, scroll up and down with the mouse wheel/trackpad.
To pan horizontally, either click and drag the chart or scroll horizontally with the mouse wheel/trackpad.
To pan vertically, either click and drag the chart or use alt + scroll.
The WASD keys also work for controlling the zoom and horizontal scroll positions.
6.CPU Profiler
You can start recording a CPU profile by clicking on record and when you are done recording, just click on stop. On doing this, the CPU profiling data is pulled from the VM and displayed in the profiler views.
7. CPU frame chart
The CPU frame chart of the profiler shows samples from the CPU for the recorded duration. This chart should be viewed as a top-down stack trace where the top-most stack frame calls the one below it. Meanwhile, the width of each stack frame represents the amount of time consumed by the CPU. If your stack frames are consuming a lot of CPU time, it may be a good decision to look for possible improvements to improve your applications performance. A pictorial representation of the CPU frame chart is given below for your reference:

Conclusion
As we have reached the end of this article, we have seen a basic overview of some essential Flutter UI performance tools which will help us in capturing performance issues. Let’s take advantage of everything we learnt here and apply it on improving the performance a poorly performing application as we move ahead. In the next article, let's explore how to profile an application on Flutter. This is all for now folks. Stay tuned.

