A Comprehensive Guide to Efficient Logging with EFK and TD Agent
Discover how the Elasticsearch Fluentd Kibana (EFK) stack and TD Agent enhance IT infrastructure by enabling efficient log management.
Table of contents
- What is EFK ? [ OS Independent ]
- What is Td-agent? [ ubuntu22.04]
- Prerequisites Installation Guide
- Setting Up td-agent on ubuntu22.04
- Testcase 1: Creating Log to Check Logging
- Testcase 2: Application log@fluent-org/logger
- Testcase 3: auth-log
- Testcase 4: Container-log
- Testcase 5: Supervisor-log
- Testcase 6: nginx-log
- Conclusion
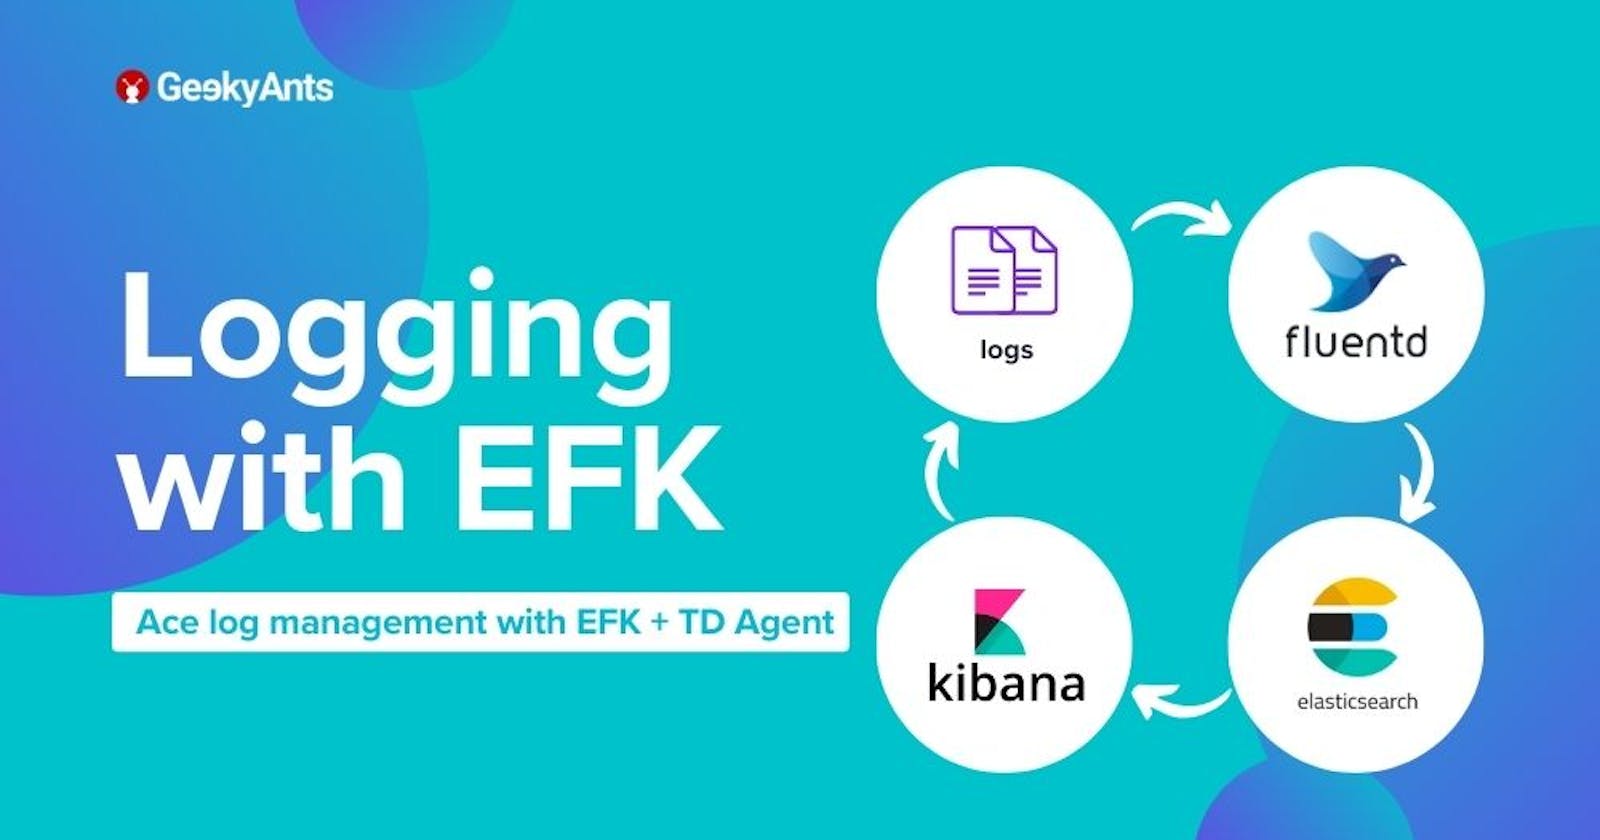
In the dynamic landscape of modern IT infrastructures, effective log management and analysis play a crucial role in maintaining systems' health, security, and performance. The EFK stack, consisting of Elasticsearch, Fluentd, and Kibana, has emerged as a powerful solution for log aggregation, storage, and visualization. When paired with the TD Agent, it becomes an even more potent tool for efficiently handling large volumes of log data.
What is EFK ? [ OS Independent ]
The EFK stack is a combination of three open-source tools:
Elasticsearch: A distributed, RESTful search and analytics engine that serves as the storage backend for log data.
Fluentd: An open-source data collector that unifies the data collection and consumption for better use and understanding. Fluentd collects, processes, and forwards log data to Elasticsearch.
Kibana: A powerful visualization tool that works in conjunction with Elasticsearch to help users explore, analyze, and visualize data stored in Elasticsearch indices. Together, these components provide a comprehensive solution for log management, offering scalability, flexibility, and ease of use.

What is Td-agent? [ ubuntu22.04]
td-agent, short for Treasure Data Agent, is an open-source data collector designed for collecting, processing, and forwarding log data. It is part of the Fluentd project, which is a popular open-source log aggregator. Fluentd is designed to unify data collection and consumption for better use in real-time data analytics. Here are some key features and aspects of td-agent:
Log Collection: td-agent is primarily used for collecting log data from various sources, such as application logs, system logs, and more. It supports a wide range of input sources.
Data Processing: It allows filtering, parsing, and transforming log data. This ensures that the collected data is formatted and structured according to the requirements before being forwarded.
Log Forwarding: The td-agent can forward log data to various output destinations, making it suitable for integrating with different storage systems or log analysis tools. Common output destinations include Elasticsearch, Amazon S3, MongoDB, and others.
Fluentd Integration: td-agent uses the Fluentd logging daemon as its core. Fluentd provides a flexible and extensible architecture for log data handling. It supports a wide range of plugins, making it adaptable to various environments.
Configuration: The configuration of td-agent is typically done through a configuration file (commonly named
td-agent.conf). This file defines input sources, processing filters, and output destinations.Ease of Use: td-agent is designed to be easy to install and configure. It is suitable for both small-scale deployments and large, distributed systems.
Community and Support: As an open-source project, td-agent benefits from an active community and ongoing development. It's well-documented, and users can find support through forums, documentation, and community channels.
When using td-agent, it is often part of a larger logging or monitoring solution. For example, in combination with Elasticsearch and Kibana, td-agent helps create an EFK (Elasticsearch, Fluentd, Kibana) stack for log management and analysis.
What problems were we facing before EFK?
Manually logging in to the server to check application logs, container logs, nginx logs, etc.
No centralized monitoring Dashboard.
No search engine.
No visualization tool.
Security issues.
Most team members have access to the server.
Prerequisites Installation Guide
Docker and Docker Compose
Docker is a containerization platform that allows you to package and distribute applications along with their dependencies. Docker Compose is a tool for defining and running multi-container Docker applications. Feel free to explore the docs.
Setting Up EFK Stack on ubuntu22.04 Setting up the Elastic, Fluentd, Kibana (EFK) stack using a Docker Compose file is a convenient way to deploy and manage the stack as containers. Project Structure:
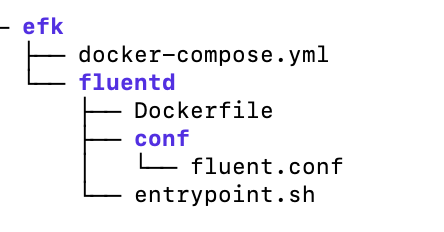
Step 1: Create Directory and Change Directory
mkdir -p ~/efk; cd ~/efk
Step 2: Create docker-compose.yml
version: "3"
volumes:
  esdata:
services:
  fluentd:
    build: ./fluentd
    links: # Sends incoming logs to the elasticsearch container.
      - elasticsearch
    depends_on:
      - elasticsearch
    ports: # Exposes the port 24224 on both TCP and UDP protocol for log aggregation
      - 24224:24224
      - 24224:24224/udp
  elasticsearch:
    image: elasticsearch:7.17.0
    expose: # Exposes the default port 9200
      - 9200
    environment:
      - discovery.type=single-node # Runs as a single-node
    volumes: # Stores elasticsearch data locally on the esdata Docker volume
      - esdata:/usr/share/elasticsearch/data
  kibana:
    image: kibana:7.17.0
    links: # Links kibana service to the elasticsearch container
      - elasticsearch
    depends_on:
      - elasticsearch
    ports: # Runs kibana service on default port 5601
      - 5601:5601
    environment: # Defined host configuration
      - ELASTICSEARCH_HOSTS=http://elasticsearch:9200
Step 3: Create Directory and Change Directory
mkdir -p fluentd/; cd fluentd/
Step 4: Create Dockerfile
# image based on fluentd v1.14-1
FROM fluentd:v1.14-1
# Use root account to use apk
USER root
# Install the required version of faraday
RUN gem uninstall -I faraday
RUN gem install faraday -v 2.8.1
# Install dependencies and gems
RUN apk --no-cache --update add \
    sudo \
    build-base \
    ruby-dev \
  && gem uninstall -I elasticsearch \
  && gem install elasticsearch -v 7.17.0 \
  && gem install fluent-plugin-elasticsearch \
  && gem sources --clear-all \
  && apk del build-base ruby-dev \
  && rm -rf /tmp/* /var/tmp/* /usr/lib/ruby/gems/*/cache/*.gem
# Copy fluentd configuration from host image
COPY ./conf/fluent.conf /fluentd/etc/
# Copy binary start file
COPY entrypoint.sh /bin/
RUN chmod +x /bin/entrypoint.sh
USER fluent
Step 5: Create entrypoint.sh
#!/bin/sh
# Source vars if file exists
DEFAULT=/etc/default/fluentd
if [ -r $DEFAULT ]; then
    set -o allexport
    . $DEFAULT
    set +o allexport
fi
# If the user has supplied only arguments, append them to `fluentd` command
if [ "${1#-}" != "$1" ]; then
    set -- fluentd "$@"
fi
# If the user does not supply a config file or plugins, use the default
if [ "$1" = "fluentd" ]; then
    if ! echo $@ | grep -e ' \-c' -e ' \-\-config' ; then
      set -- "$@" --config /fluentd/etc/${FLUENTD_CONF}
    fi
    if ! echo $@ | grep -e ' \-p' -e ' \-\-plugin' ; then
      set -- "$@" --plugin /fluentd/plugins
    fi
fi
exec "$@"
Step 6: Create Directory and Change Directory
mkdir -p conf/; cd conf/
Step 7: Create fluent.conf
# bind fluentd on IP 0.0.0.0
# port 24224
<source>
  @type forward
  port 24224
  bind 0.0.0.0
</source>
# sendlog to the elasticsearch
# the host must match to the elasticsearch
# container service
<match *.**>
  @type copy
  <store>
    @type elasticsearch
    host elasticsearch
    port 9200
    logstash_format true
    logstash_prefix fluentd
    logstash_dateformat %Y%m%d
    include_tag_key true
    type_name access_log
    tag_key @log_name
    flush_interval 20s
  </store>
  <store>
    @type stdout
  </store>
</match>
Change directory to efk and run the Docker container:
cd ~/efk/
docker-compose up -d
Check logs for service fluentd and kibana:
docker-compose logs fluentd
docker-compose logs kibana
Check the running container:
docker-compose ps

docker inspect efk_elasticsearch_1

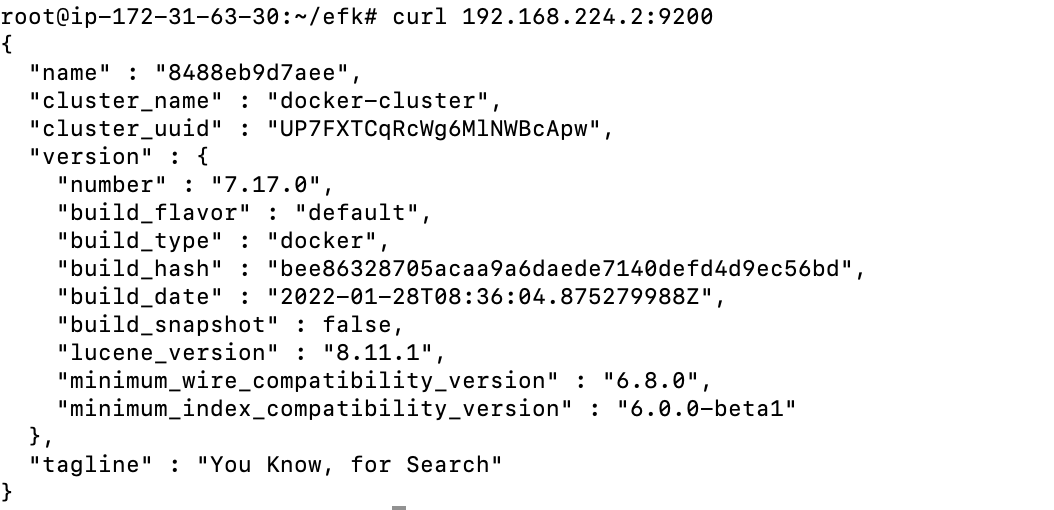
curl 192.168.224.2:9200
On the Dashboard
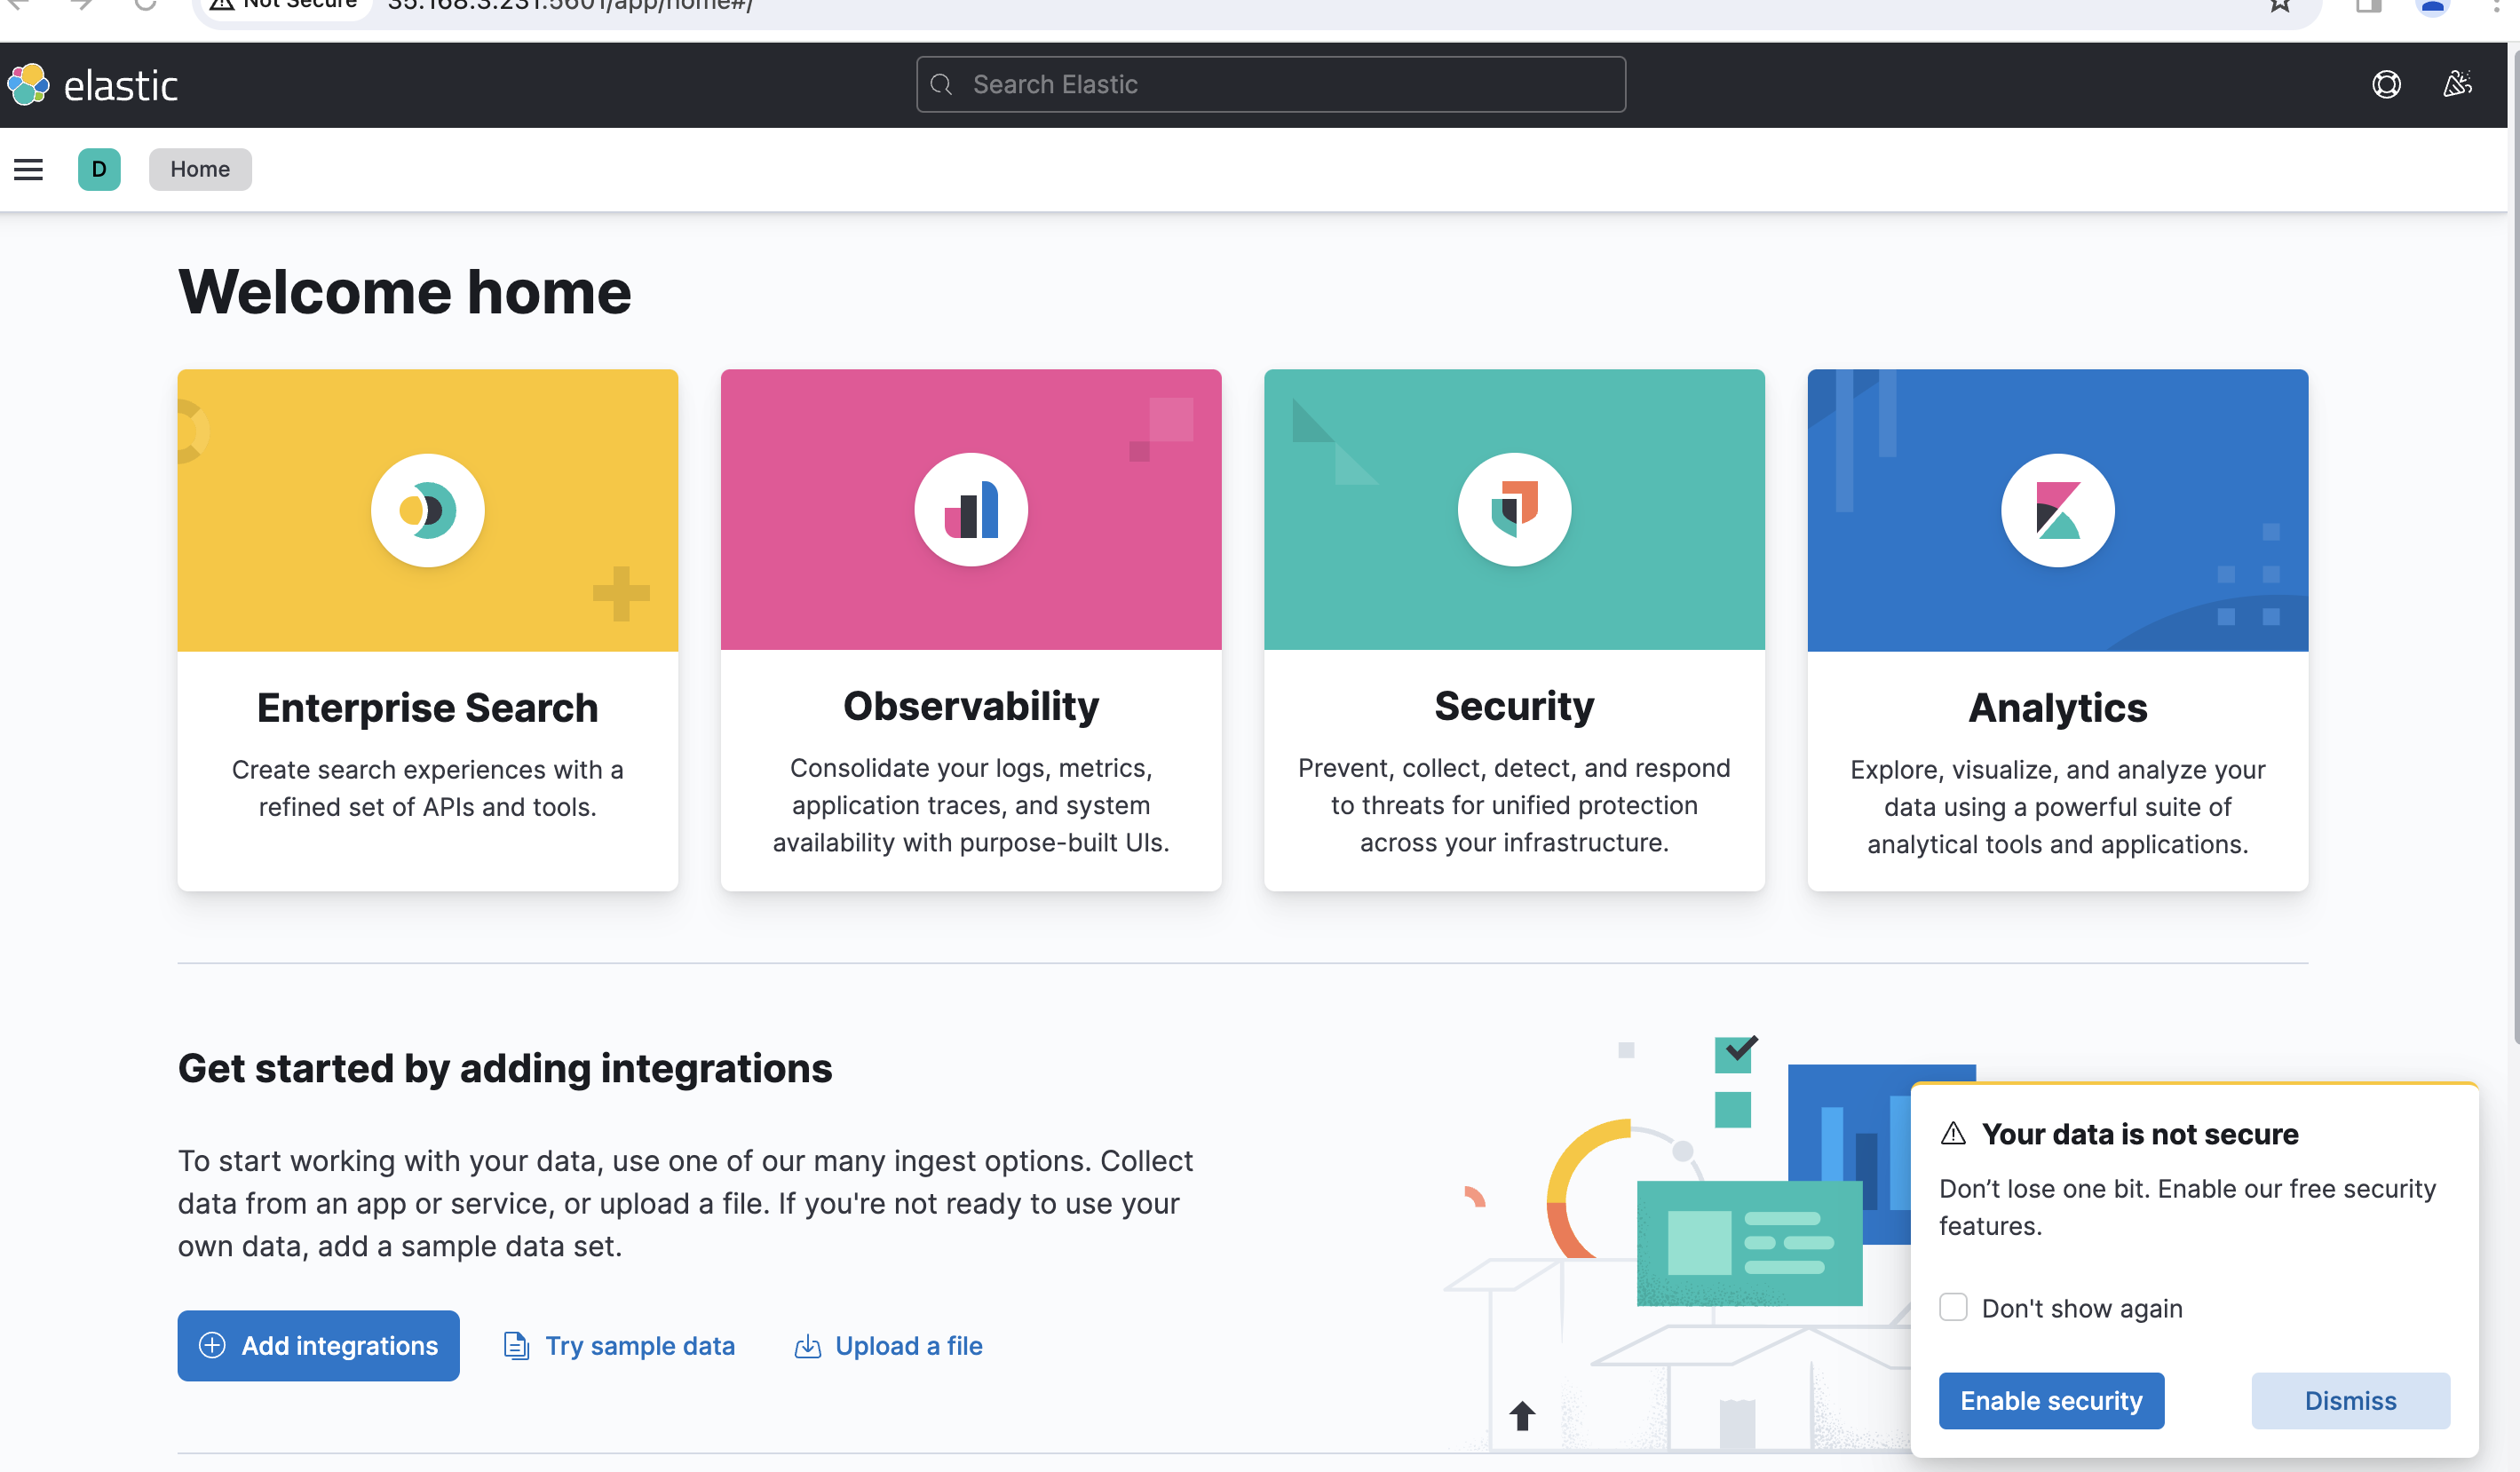
1. Public ip:5601
2. Next, click the Explore on My Own button on the welcome page below.
3. Click the Stack Management option to set up the Kibana index pattern in the Management section.
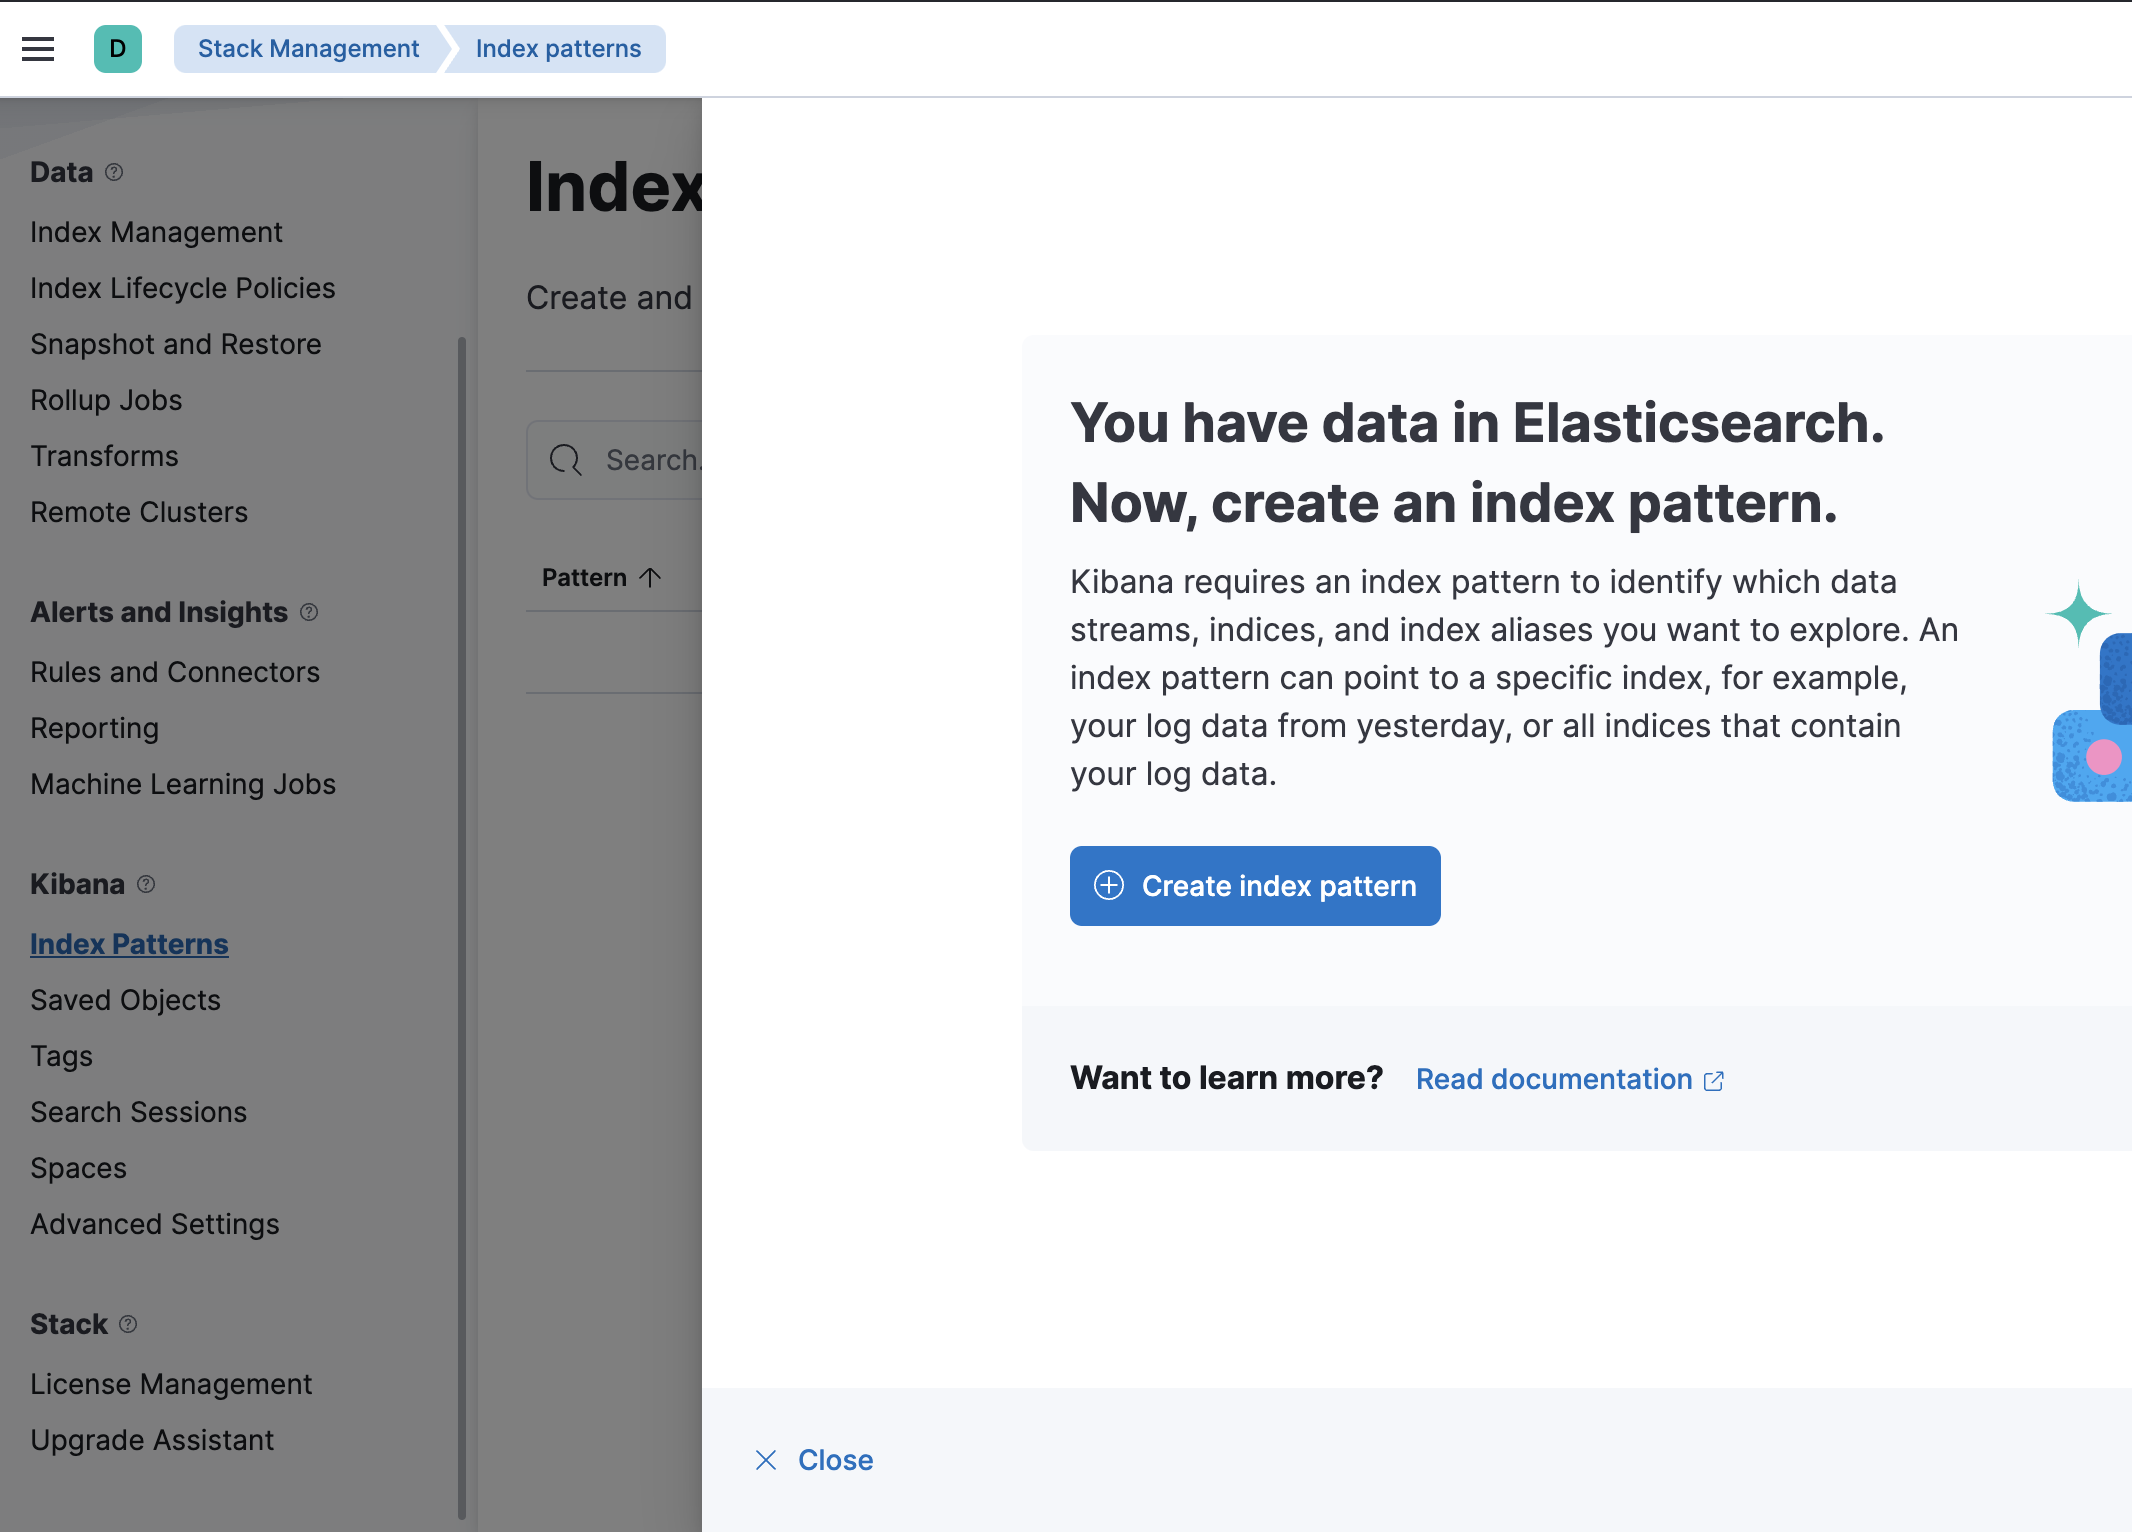
4. On the Kibana left menu section, click the menu Index Patterns and click the Create Index Pattern button to create a new index pattern.
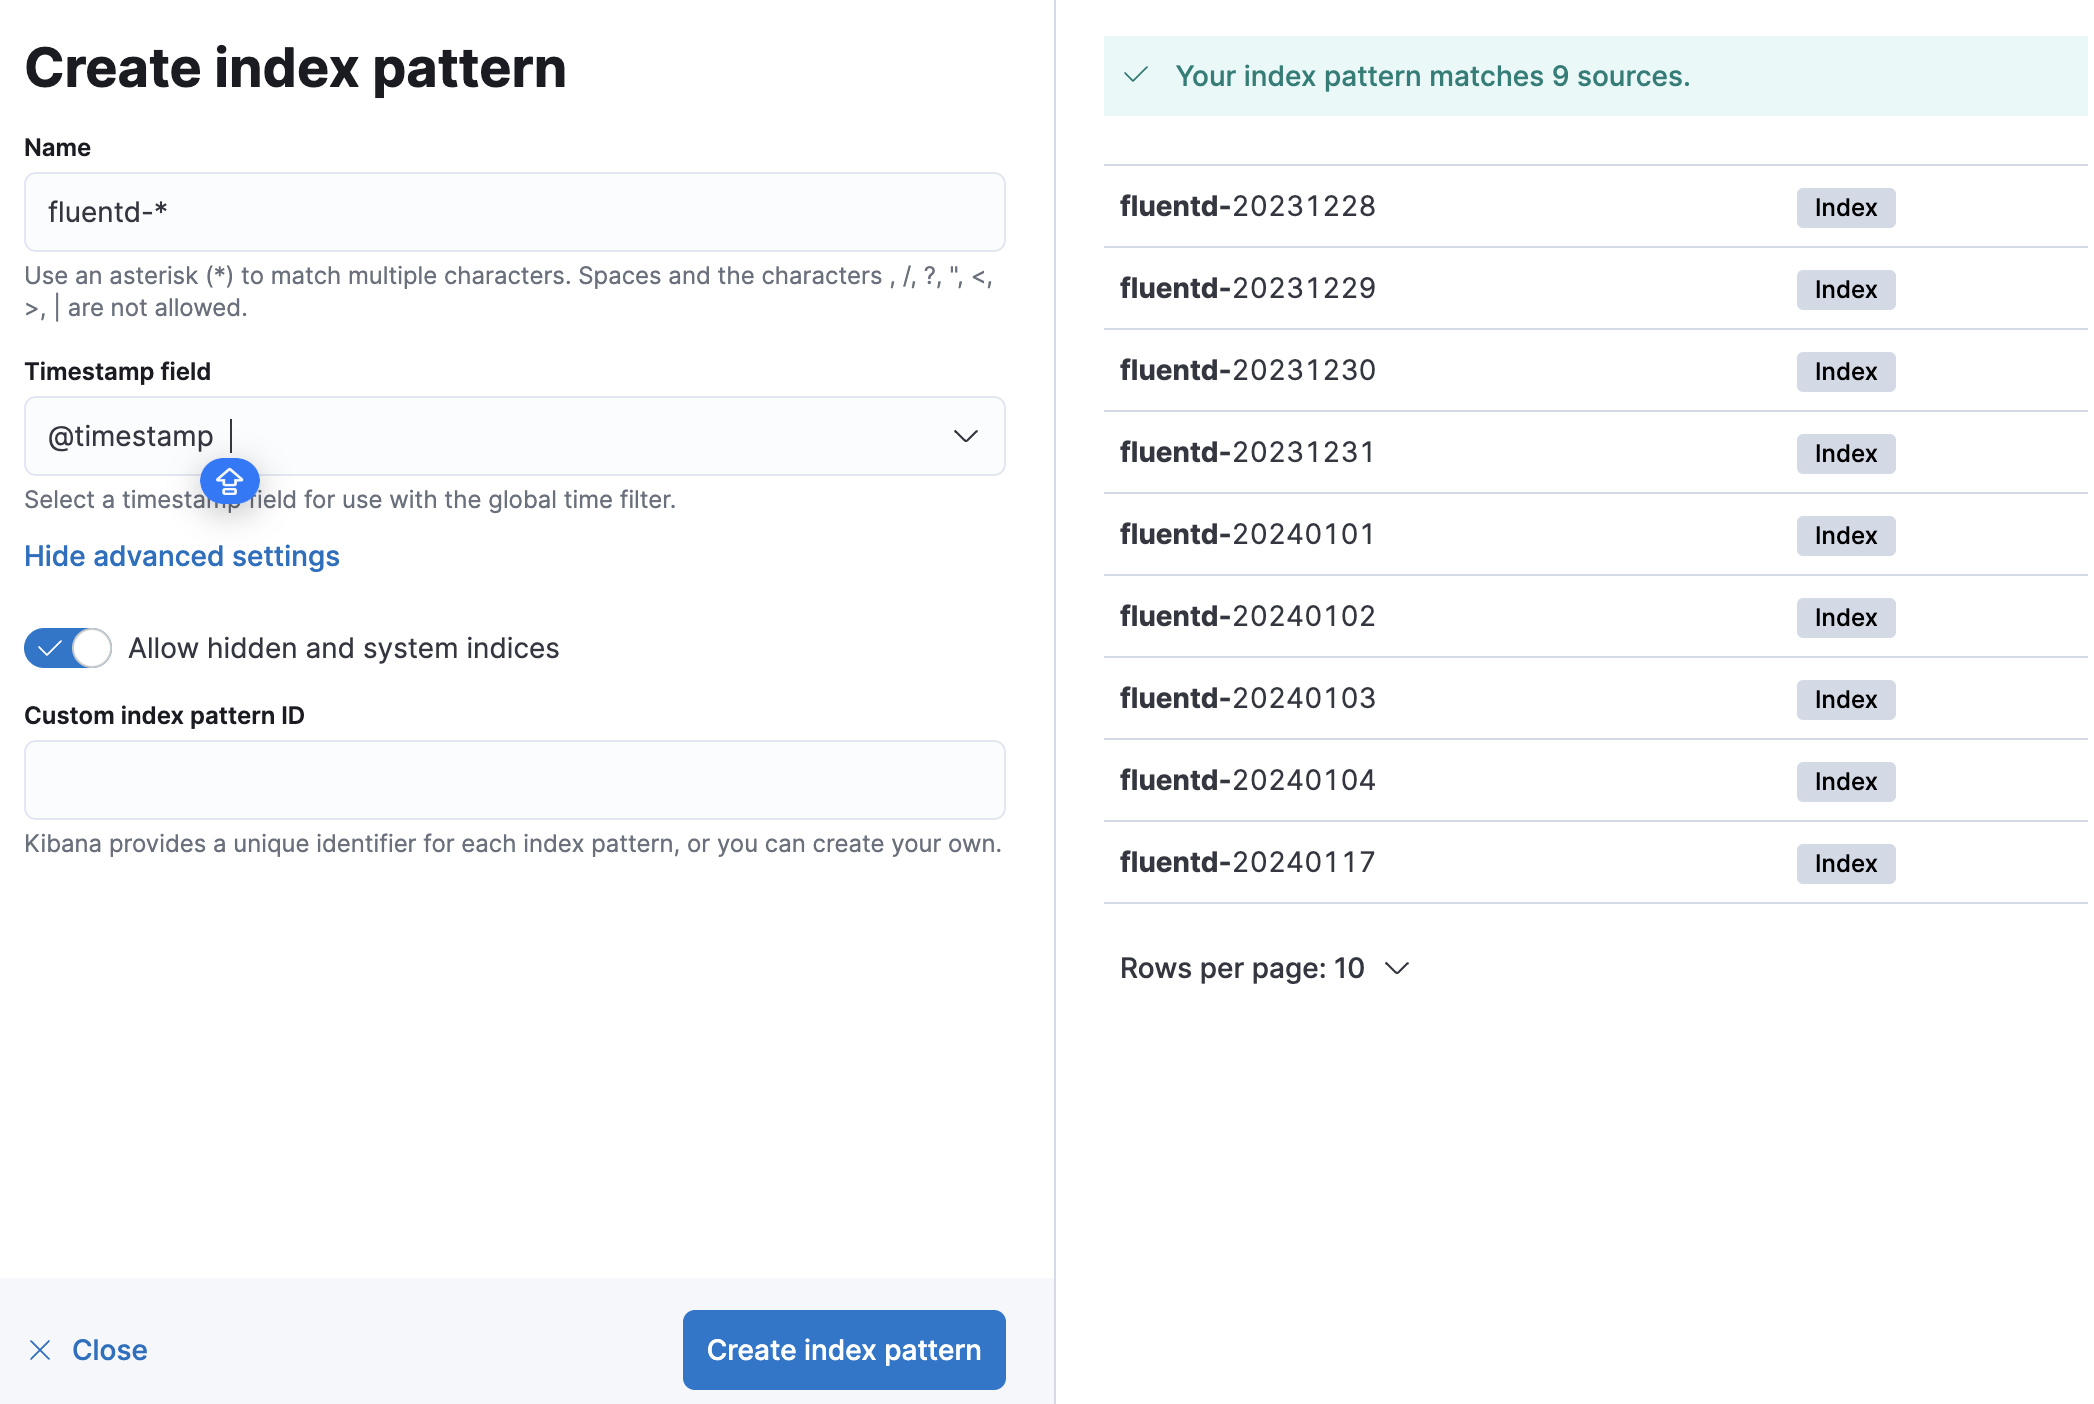
5. Now, input the index pattern Name as fluentd-*, set the Timestamp field to @timestamp, and click the Create index pattern button to confirm the index pattern settings.
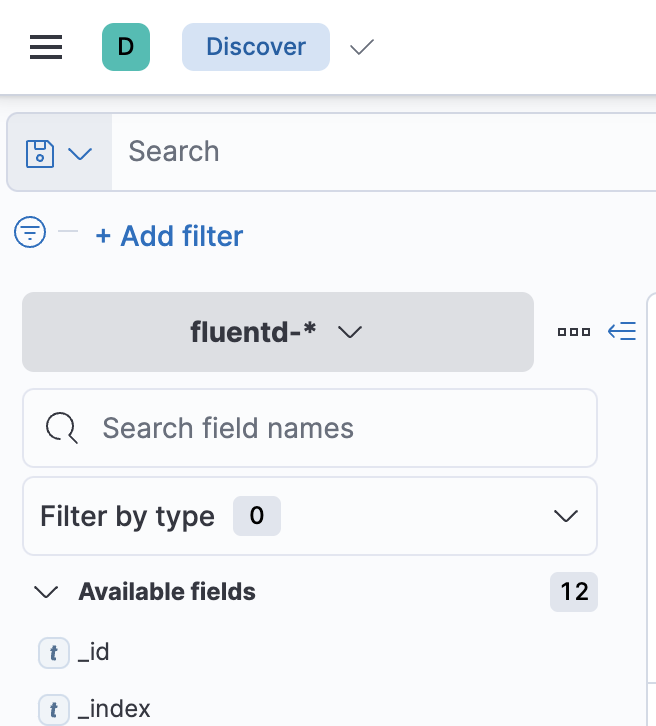
6. Lastly, click on the top left menu (ellipsis), then click the Discover menu to show the logs monitoring.
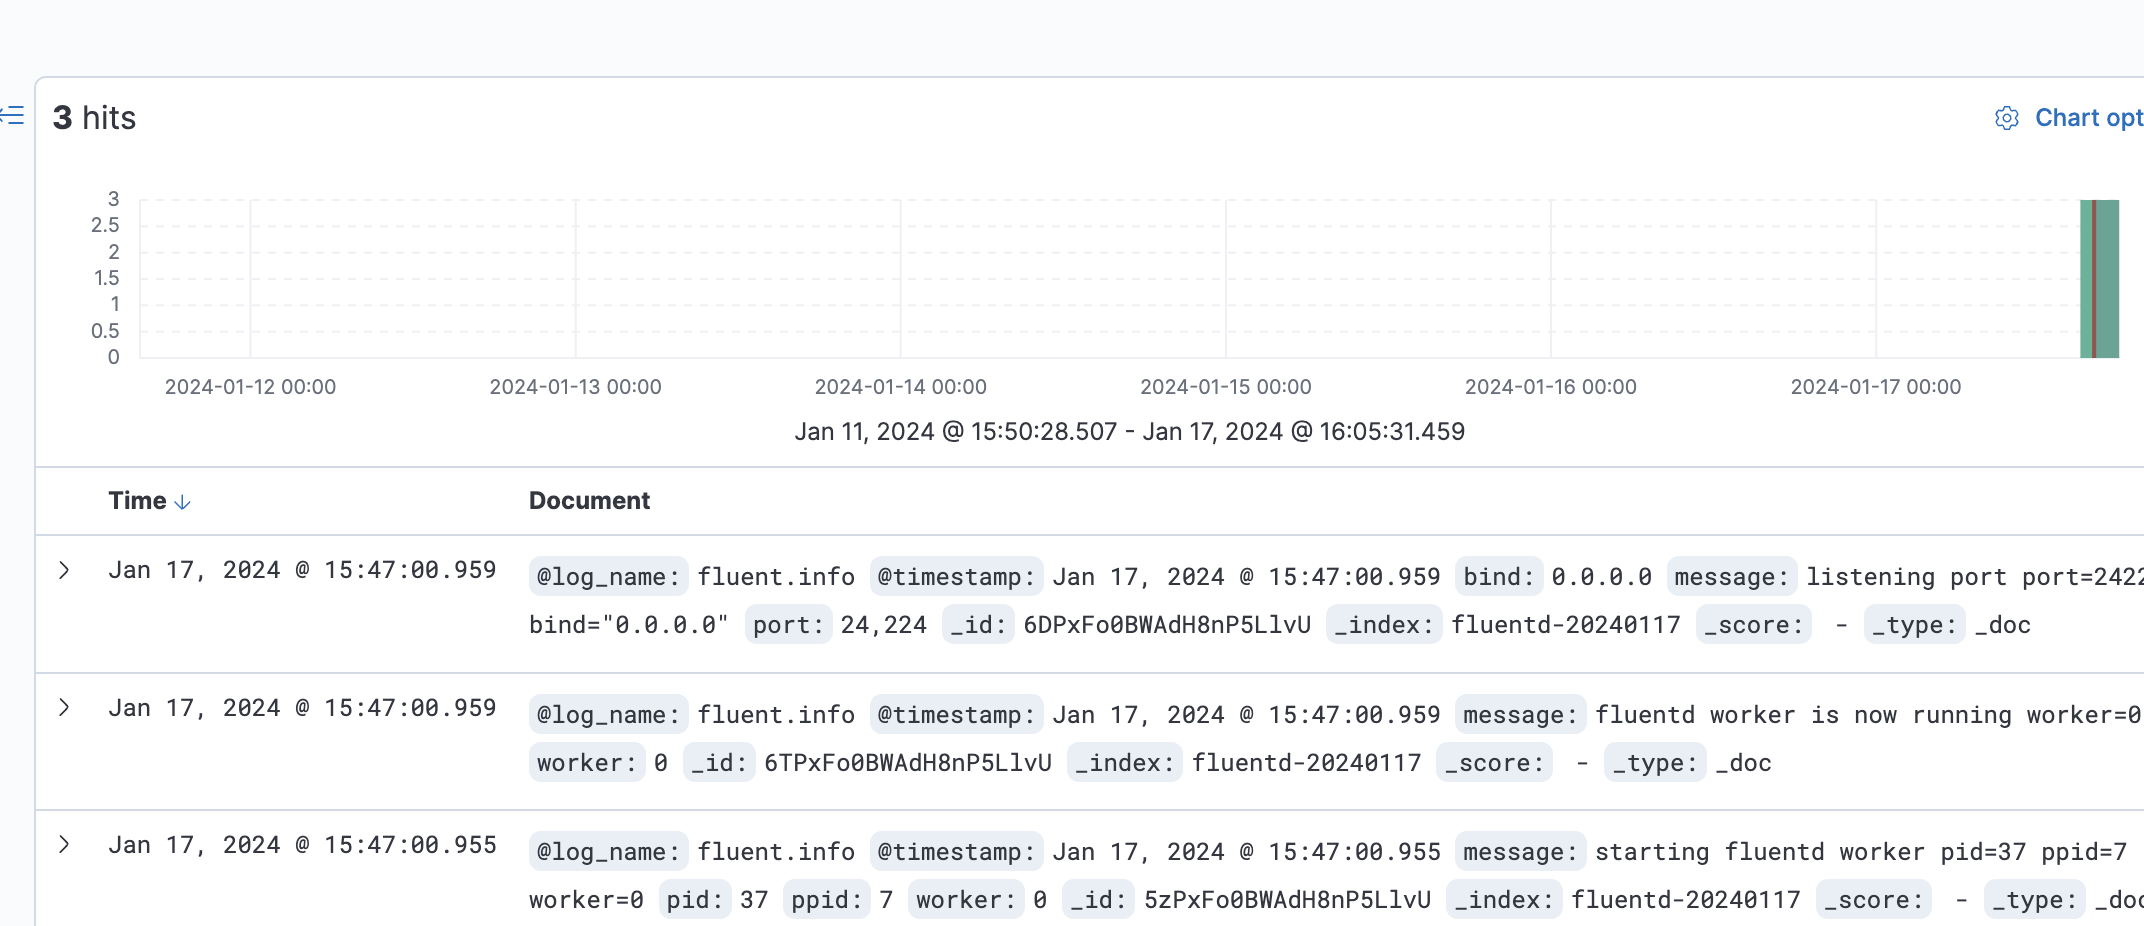
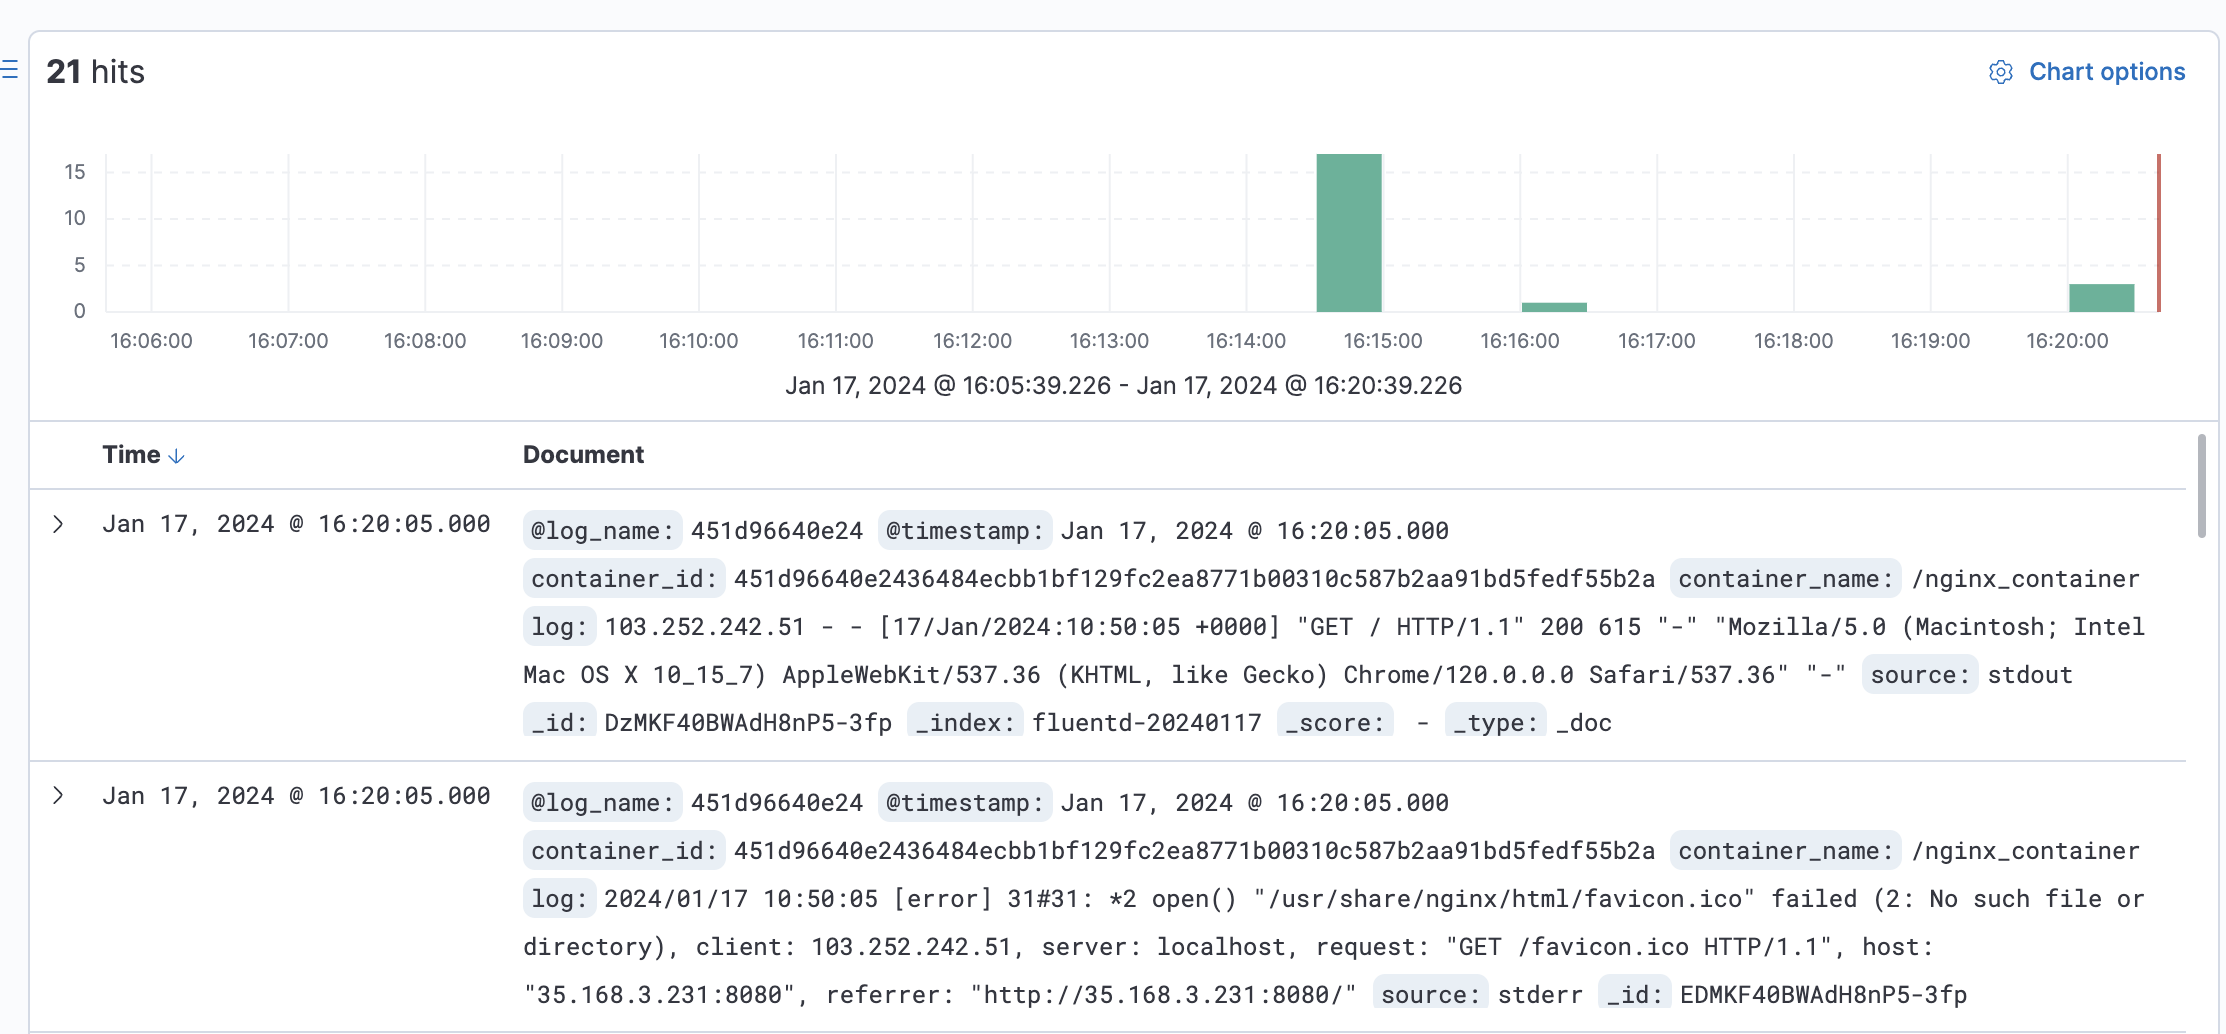
7. Below is the screenshot of the Kibana log monitoring and analysis dashboard. All listed logs are taken from the Elasticsearch and shipped by the Fluentd log aggregation.
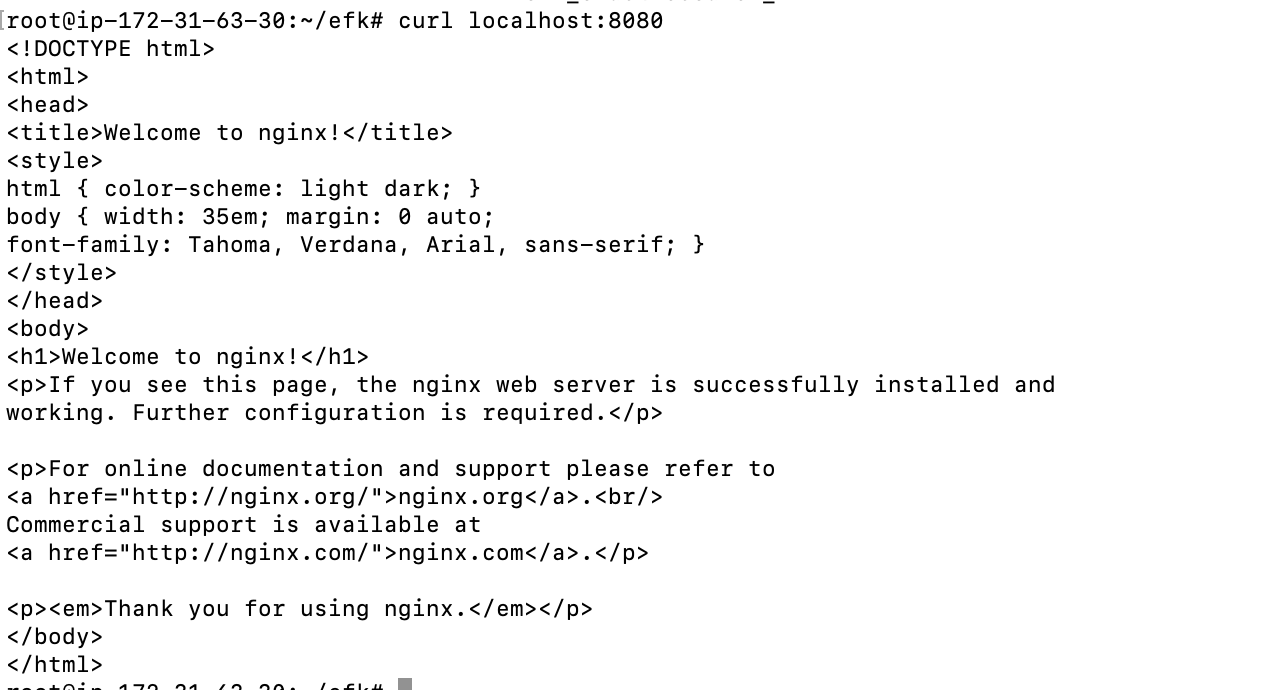
Run a Docker container by utilizing the Fluentd log driver
docker run --name nginx_container -d --log-driver=fluentd -p 8080:80 nginx:alpine
curl localhost:8080
Lastly, switch back to the Kibana dashboard, and click the Discover menu on the left side.
Setting Up td-agent on ubuntu22.04
Setting up TD Agent (Treasure Data Agent) using Script allows for automation. TD Agent is commonly used for log forwarding and aggregation. In this guide, we will walk through the steps to set up TD Agent using Script.

td-agent/install_td_agent.sh
#!/bin/bash

# Script to install td-agent on Ubuntu

# Download and execute the TD Agent installation script
curl -fsSL https://toolbelt.treasuredata.com/sh/install-ubuntu-jammy-td-agent4.sh | sh

# Check if TD Agent is installed successfully
if [ ! -e /etc/td-agent/td-agent.conf ]; then
    echo "Error: TD Agent installation failed or configuration file does not exist."
    exit 1
fi

# Edit rsyslog configuration to forward system logs to TD Agent
echo '*.* @127.0.0.1:42185' | sudo tee -a /etc/rsyslog.conf

# Restart rsyslog service to apply the changes
sudo systemctl restart rsyslog

# Move the existing td-agent.conf to create a backup if it exists
if [ -e /etc/td-agent/td-agent.conf ]; then
    sudo mv /etc/td-agent/td-agent.conf /etc/td-agent/td-agent.back
fi


# Copy td-agent.conf.j2 to /etc/td-agent/td-agent.conf
sudo cp /root/td-agent/td-agent.conf.j2 /etc/td-agent/td-agent.conf
sudo systemctl stop td-agent.service
sudo systemctl enable td-agent.service
sudo systemctl start td-agent.service
td-agent/td-agent.conf.j2
<source>
  @type syslog
  @id input_syslog
  port 42185
  tag test.system [hostname of agent server instead of test]
</source>

<match *.**>
  @type forward
  @id forward_syslog
  <server>
    host x.x.x.x [ip-address of fluentd]
  </server>
</match>
Remember to execute the script with the appropriate permissions:
chmod +x install_td_agent.sh
./install_td_agent.sh
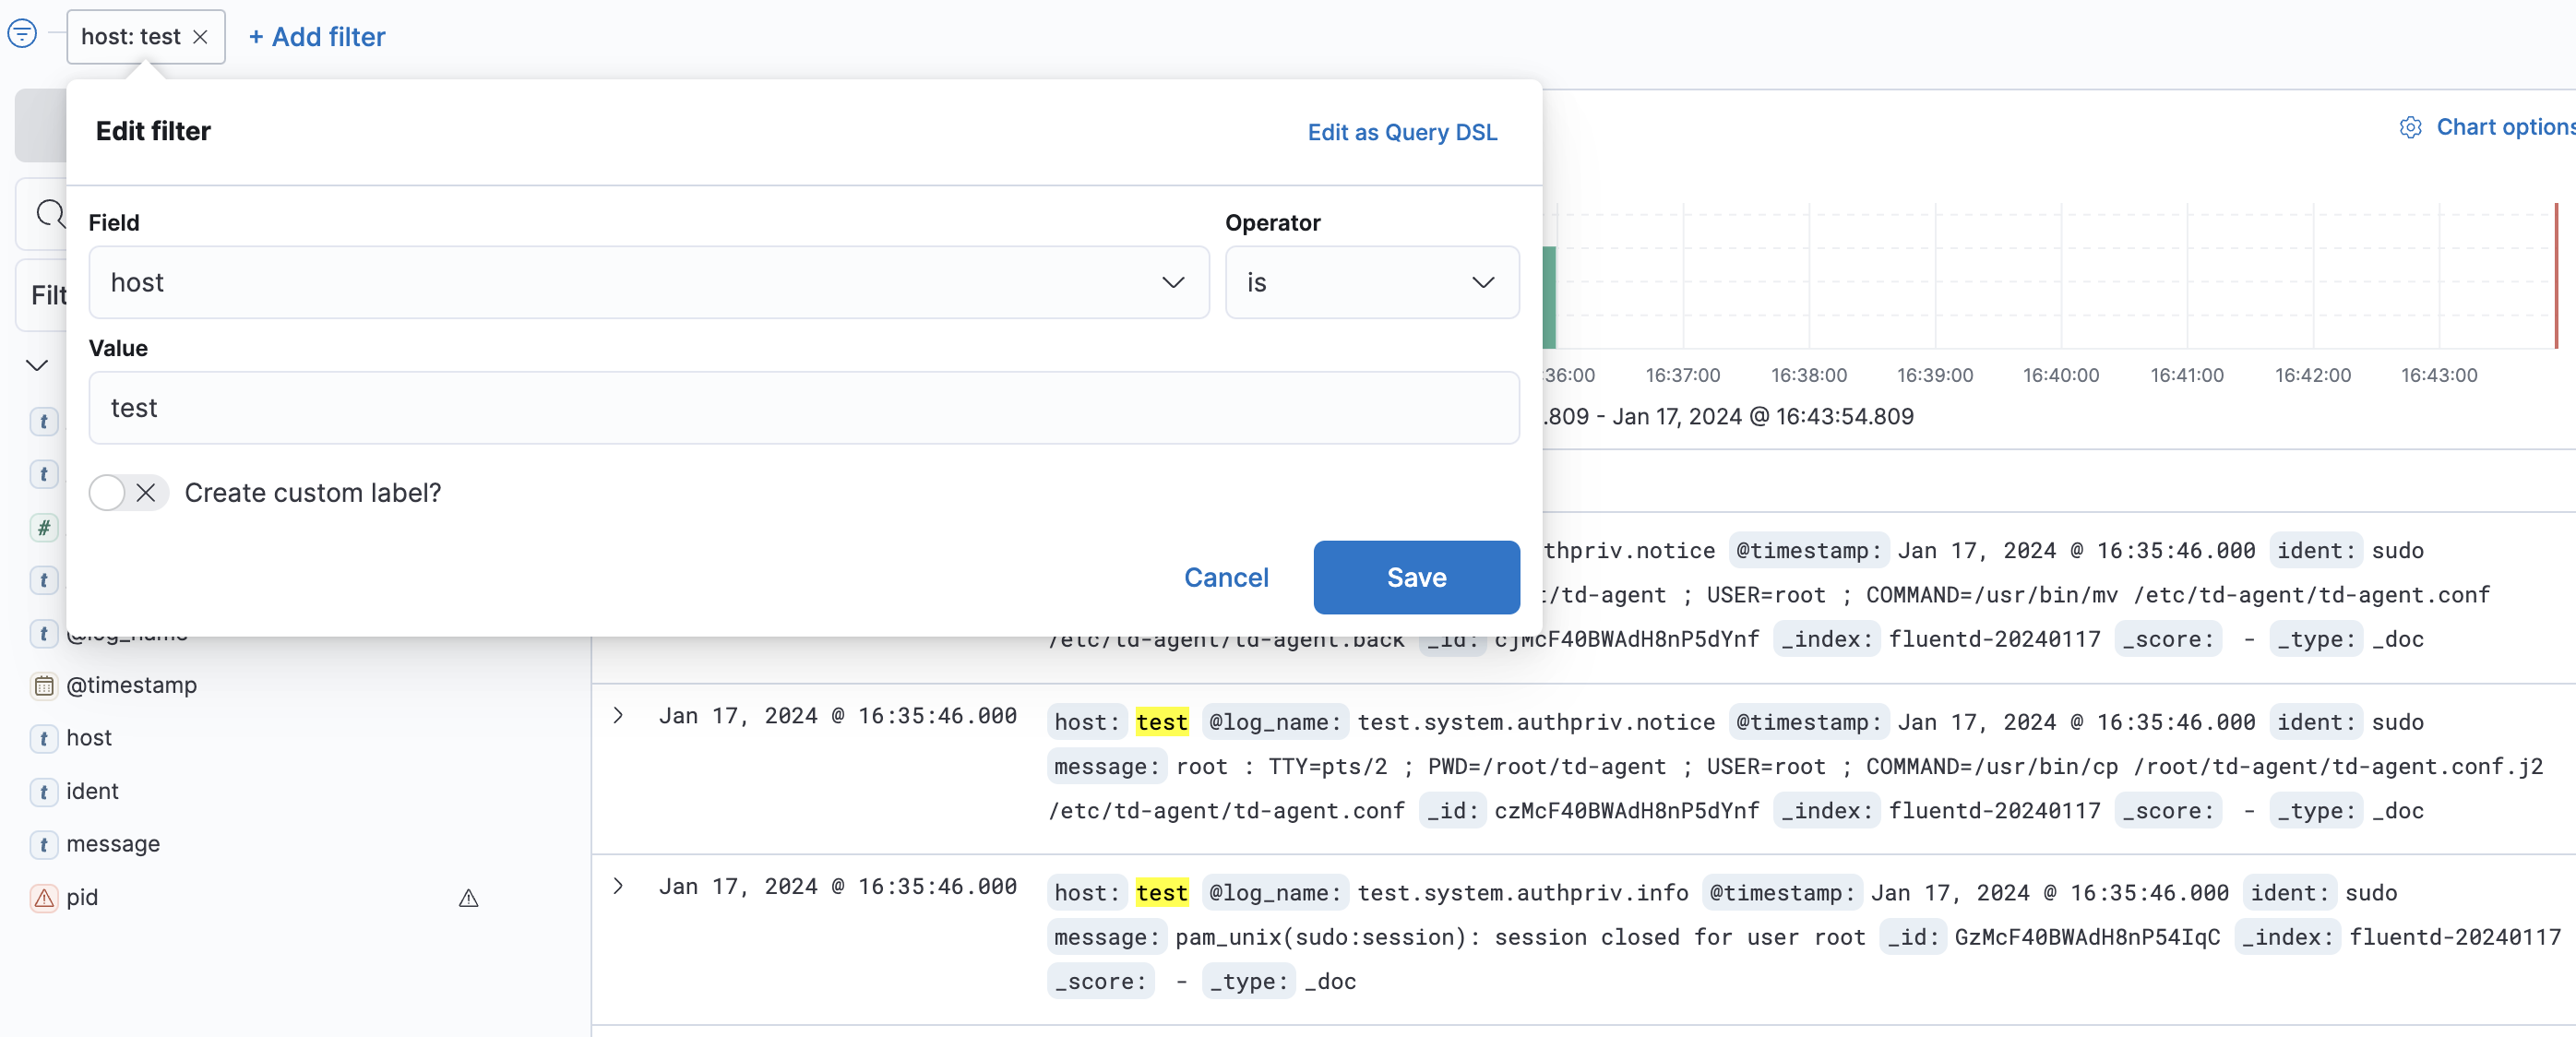
Check using filter on kibana dashboard
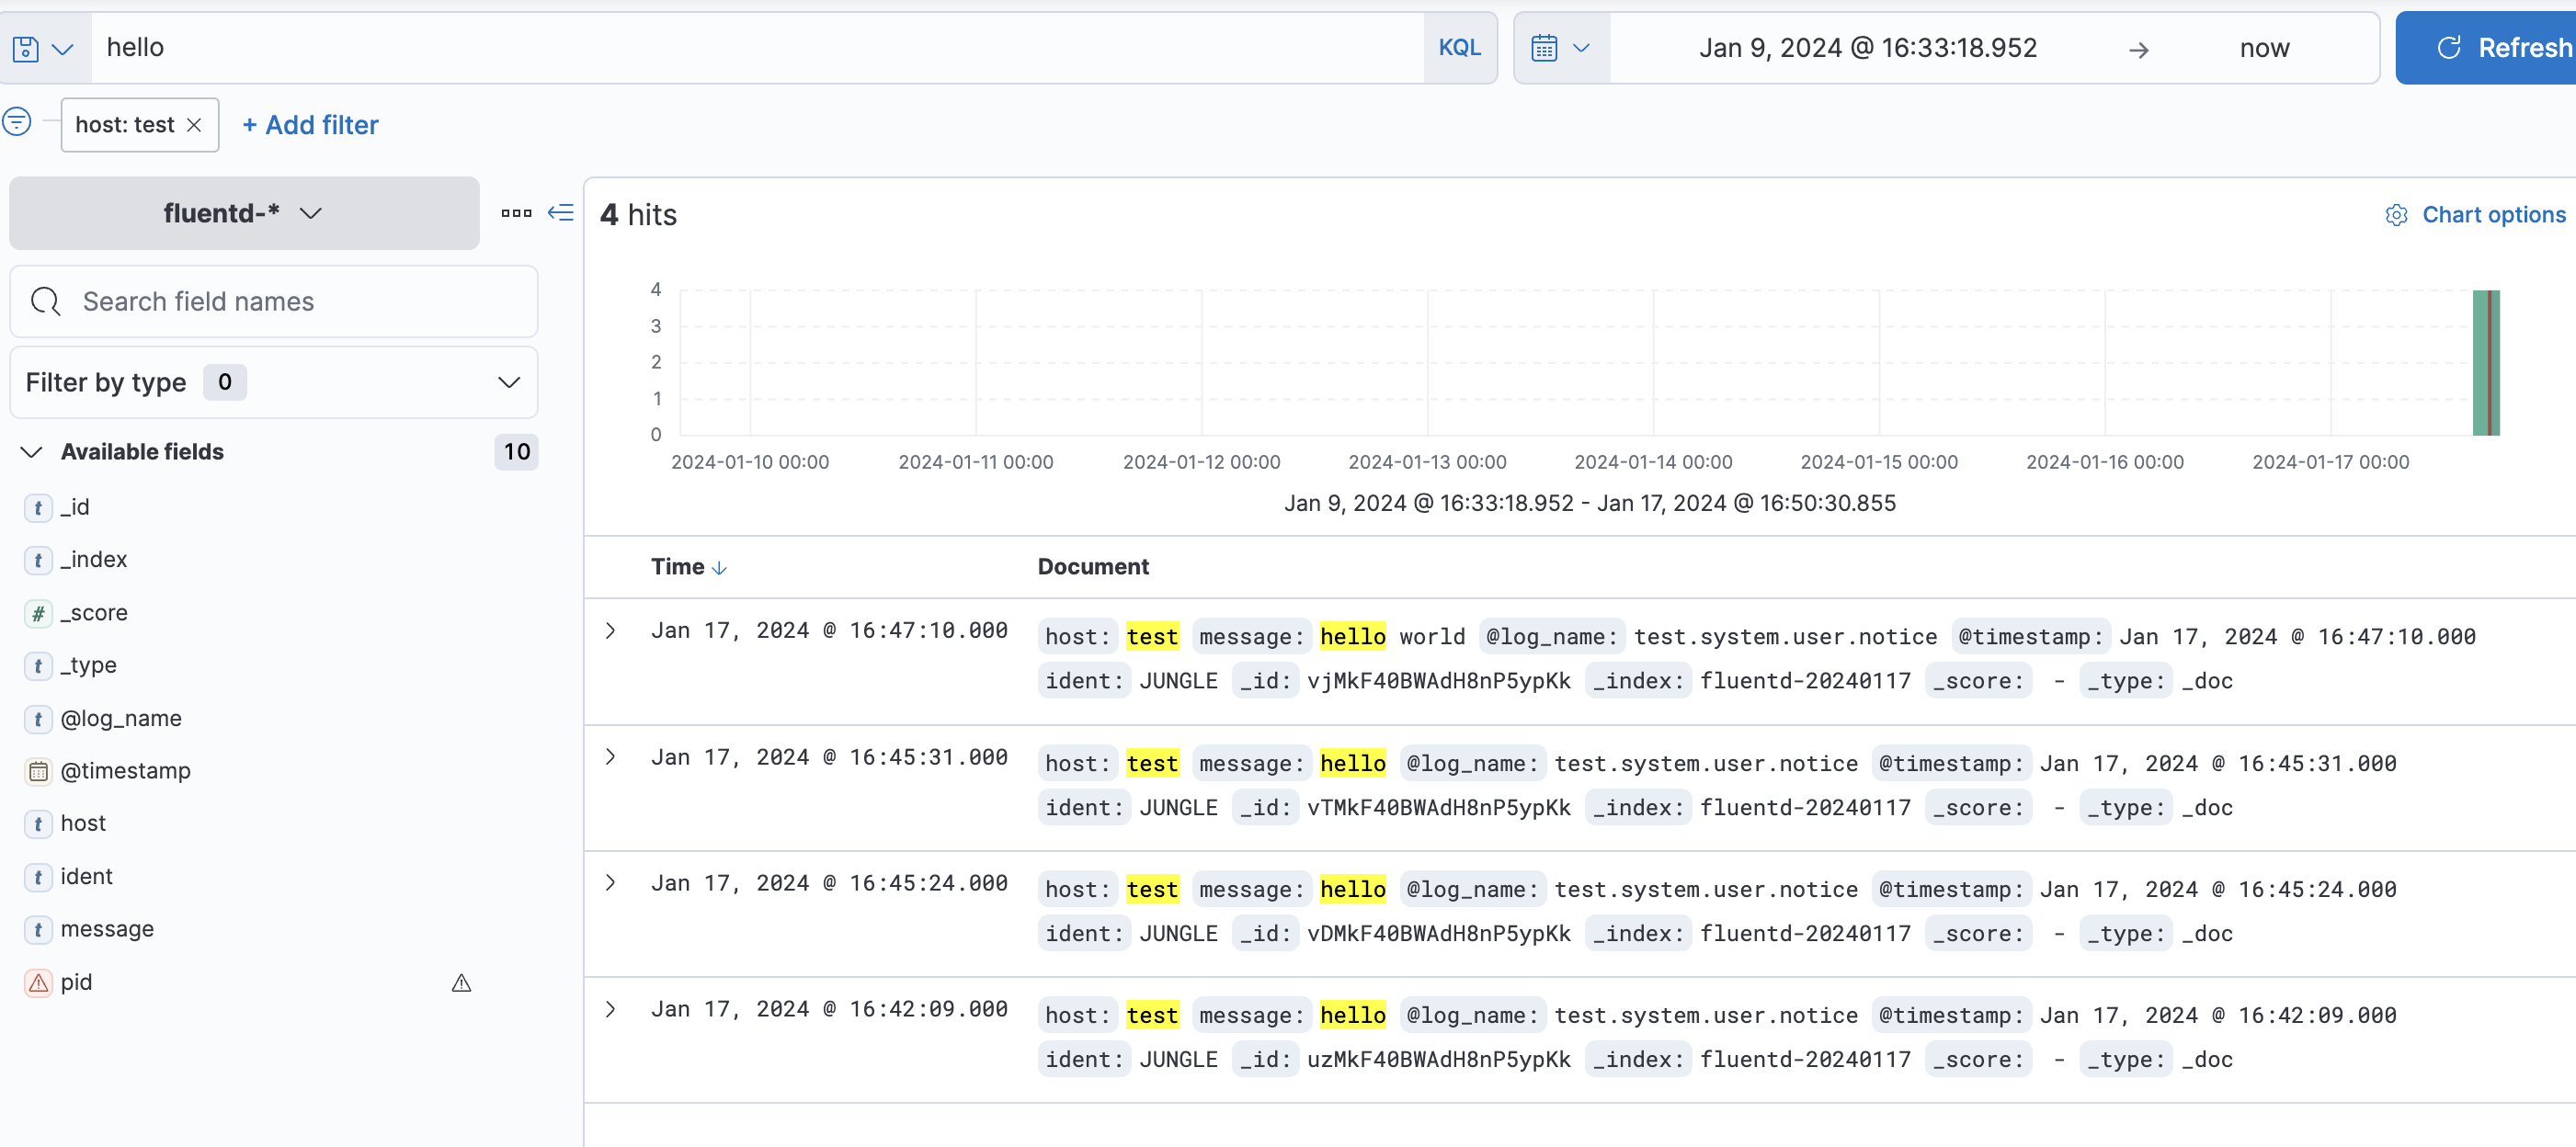
Testcase 1: Creating Log to Check Logging
logger -t JUNGLE hello
Testcase 2: Application log@fluent-org/logger
tag- log_name: fluentd.test.follow

Prerequisites: Basic knowledge of Node.js and NPM Package.json.
{
  "name": "node-example",
  "version": "0.0.1",
  "dependencies": {
    "express": "^4.16.0",
    "@fluent-org/logger": "^1.0.2"
  }
}
Use npm to install dependencies locally:
npm install
index.js:
const express = require('express');
const FluentClient = require('@fluent-org/logger').FluentClient;
const app = express();

// The 2nd argument can be omitted. Here is a default value for options.
const logger = new FluentClient('fluentd.test', {
  socket: {
    host: 'localhost',
    port: 24224,
    timeout: 3000, // 3 seconds
  }
});

app.get('/', function(request, response) {
  logger.emit('follow', {from: 'userA', to: 'userB'});
  response.send('Hello World!');
});
const port = process.env.PORT || 3000;
app.listen(port, function() {
  console.log("Listening on " + port);
});
Run the app and go to http://public-ip:3000/ in your browser to send the logs to Fluentd:
node index.js

Testcase 3: auth-log
Add the following lines to fluent.conf. After adding these lines, remove the previous Docker images. Then, run 'docker-compose up' again in the ~/efk directory. tag- log_name: hostname.system.auth.info
<source>
  @type tail
  path /var/log/auth.log
  tag auth_log_data
  <parse>
    @type syslog
  </parse>
</source>

<source>
  @type tail
  path /var/log/auth.log
  format /^\<(?<pri>[0-9]+)\>(?<time>[^ ]* {1,2}[^ ]* [^ ]*) (?<host>[^ ]*) (?<ident>[a-zA-Z0-9_\/\.\-]*)(?:\[(?<pid>[0-9]+)\]) *(?<message>.*)$/
  tag authlog
</source>

Login to the server again to generate auth-log:
docker-compose logs -f fluentd
Below are fluentd Container Logs:


On Kibana Dashboard:


Testcase 4: Container-log
Add the following lines to fluent.conf. After adding these lines, remove the previous Docker images. Then, run 'docker-compose up' again in the ~/efk directory. tag: container name:
<source>
  @type tail
  path /var/lib/docker/containers/*/*.log
  tag containerlog
  <parse>
    @type syslog
  </parse>
</source>

<source>
  @type tail
  path /var/lib/docker/containers/*/*.log
  format /^\<(?<pri>[0-9]+)\>(?<time>[^ ]* {1,2}[^ ]* [^ ]*) (?<host>[^ ]*) (?<ident>[a-zA-Z0-9_\/\.\-]*)(?:\[(?<pid>[0-9]+)\]) *(?<message>.*)$/
  tag conatiner_log_data
</source>

Testcase 5: Supervisor-log
Add the following lines to fluent.conf. After adding these lines, remove the previous Docker images. Then, run 'docker-compose up' again in the ~/efk directory.
tag- log_name: hostname.system.daemon.info
<source>
  @type tail
  path /var/log/supervisor/*.log
  tag supervisorlog
  <parse>
    @type syslog
  </parse>
</source>

<source>
  @type tail
  path /var/log/supervisor/*.log
  format /^\<(?<pri>[0-9]+)\>(?<time>[^ ]* {1,2}[^ ]* [^ ]*) (?<host>[^ ]*) (?<ident>[a-zA-Z0-9_\/\.\-]*)(?:\[(?<pid>[0-9]+)\]) *(?<message>.*)$/
  tag supervisor_log_data
</source>

Testcase 6: nginx-log
Add the following lines to fluent.conf. After adding these lines, remove the previous Docker images. Then, run 'docker-compose up' again in the ~/efk directory. tag- log_name: hostname.system.daemon.info
<source>
  @type tail
  path /var/log/nginx/*.log
  tag nginxlog
  <parse>
    @type syslog
  </parse>
</source>

<source>
  @type tail
  path /var/log/nginx/*.log
  format /^\<(?<pri>[0-9]+)\>(?<time>[^ ]* {1,2}[^ ]* [^ ]*) (?<host>[^ ]*) (?<ident>[a-zA-Z0-9_\/\.\-]*)(?:\[(?<pid>[0-9]+)\]) *(?<message>.*)$/
  tag nginx_log_data
</source>

Conclusion
The EFK stack provides a comprehensive logging solution that can handle a large amount of data and provide real-time insights into the behavior of complex systems. Elasticsearch, Fluentd, and Kibana work together seamlessly to collect, process, and visualize logs, making it easy for developers and system administrators to monitor their applications' and infrastructure's health and performance. If you’re looking for a powerful logging solution, consider using the EFK stack.
Check out these additional resources:
Official docs link: https://docs.fluentd.org/v/0.12/articles/docker-logging-efk-compose and https://blog.yarsalabs.com/efk-setup-for-logging-and-visualization/
OS support: Download Td-Agent and Download efk
Alternative solution: ELK [ elasticsearch logstash kibana ], Graylog, Splunk, Fluent Bit and Grafana Loki
This article was written by Nandani Sah, Software Engineer In Platforms - I at GeekyAnts, for the GeekyAnts blog.

