Zabbix: An Introduction To The Server Monitoring Tool
Zabbix is an open source tool offering enterprise-class server monitoring solutions. Learn more through this read!

Hi, I’m Aditya Prakash, a Senior DevOps Engineer II at GeekyAnts India Pvt. Ltd. With over three years of experience in DevOps and cloud solutions, I specialize in designing, implementing, and optimizing cloud infrastructure. My expertise spans multiple Cloud Service Providers, including AWS, Azure, GCP, and DigitalOcean.
I hold certifications as an AWS Certified Developer Associate and Microsoft Azure Certified Developer Associate, which reflect my deep understanding of cloud technologies. My passion lies in solving complex technical challenges and bridging the gap between development and operations, with a strong focus on building efficient systems and automating workflows.
With hands-on experience in managing and automating the entire DevOps lifecycle, I am skilled in configuration management, CI/CD pipelines, and Infrastructure as Code (IaC). I continuously strive to improve cloud-based deployments, ensuring they are scalable, reliable, and optimized for performance. I am always exploring new technologies and sharing insights with the community to drive innovation and best practices in the DevOps space.
Just setting up servers and deploying applications on them is not enough; it is also important that one can easily monitor the performance of all the servers from a centralized location for increased efficiency. This is where server monotony tools come in! Let's learn more about one of these tools in this read:
What is server monitoring?
Server monitoring is the process of monitoring any required server's system resources which include CPU usage, memory sage, input/output, network, disk usage, processes etc. They also have the ability to implement thresholds over which an alert can be triggered, based on which the load on any required resource can easily be found, reduced and brought under control.
There are a such tools like:
In this article we discuss about one such tool, i.e., Zabbix. We will discuss on how to set up a Zabbix Server, install a Zabbix agent on any server that needs to be monitored, how to setup alerts and send notifications via email and Slack and also it comparison with widely known Nagios monitoring tool.
What is Zabbix?
Zabbix is an enterprise-class open source distributed monitoring solution for monitoring servers. It is a useful software used by developers to monitor numerous parameters of a network and the health and integrity of servers, virtual machines, applications, services, databases, websites, the cloud and more. Zabbix uses a flexible notification mechanism that alerts users of issues via a number of platforms like email, Slack, Jira, Brevis.one etc. One of its major advantage is that it is an open source software which means it is absolutely free of cost and also comes with a good monitoring system along with data visualization.
The Zabbix server collects data from all its agents, analyzes and gives a proper data representation of the same. It also provides a customizable and easy way to interpret the web UI/dashboard with various widgets, graphs, network maps, slideshows and reports. So, let's get started:
For this I have installed a few CentOS systems, one on which Zabbix Server is configured and others on which agents will be installed for their respective monitoring
Setting up the Zabbix server
- Install the Apache Server using the code given below:
sudo dnf -y install httpd
- Next, enable the required service and start and view its status using the snippet given below:
sudo systemctl enable httpd
sudo systemctl start httpd
sudo systemctl status httpd
- Next, install and configure MariaDB for Zabbix to work on your server. After having installed MariaDB, create a database for Zabbix users and shown below:
mysql -u root -p

CREATE DATABASE zabbix character set utf8 collate utf8_bin;
GRANT ALL PRIVILEGES ON zabbix.* TO zabbix@'localhost' IDENTIFIED BY 'AnyPasswordYouWant';
FLUSH PRIVILEGES;
QUIT;
- To proceed, install and configure the Zabbix server along with the required Zabbix server packages:
sudo dnf -y install https://repo.zabbix.com/zabbix/5.0/rhel/8/x86_64/zabbix-release-5.0-1.el8.noarch.rpm
sudo dnf -y install zabbix-server-mysql zabbix-web-mysql zabbix-apache-conf zabbix-agent
- After having done this, import the initial schema and data for the Zabbix server with MySQL as demonstrated below:
sudo su -
zcat /usr/share/doc/zabbix-server-mysql*/create.sql.gz | mysql -u zabbix -p zabbix
- Now edit the
/etc/zabbix/zabbix_server.confand set the respective database name, user and password. Here's a code snippet for your reference:
sudo vi /etc/zabbix/zabbix_server.conf
DBName=zabbix
DBUser=zabbix
DBPassword=PasswordOfYouChoice
- Next, configure the Frontend of the system and implement a Firewall to proceed and edit
/etc/php-fpm.d/zabbix.confto set the right timezone:
sudo vi /etc/php-fpm.d/zabbix.conf
php_value[date.timezone] = Your choice from std. timezones
- Then restart and enable services to confirm the status of
zabbix-serverto be active as demonstrated below:
systemctl restart zabbix-server zabbix-agent httpd php-fpm
sudo systemctl enable zabbix-server zabbix-agent httpd php-fpm
systemctl status zabbix-server
- Allow access to the Firewall on port 10050 and 10051 to complete the installation process using the code given below:
sudo firewall-cmd --add-service=http --permanent
sudo firewall-cmd --add-port={10051,10050}/tcp --permanent
sudo firewall-cmd --reload
- Now restart the portal using the code given below:
sudo systemctl restart httpd php-fpm
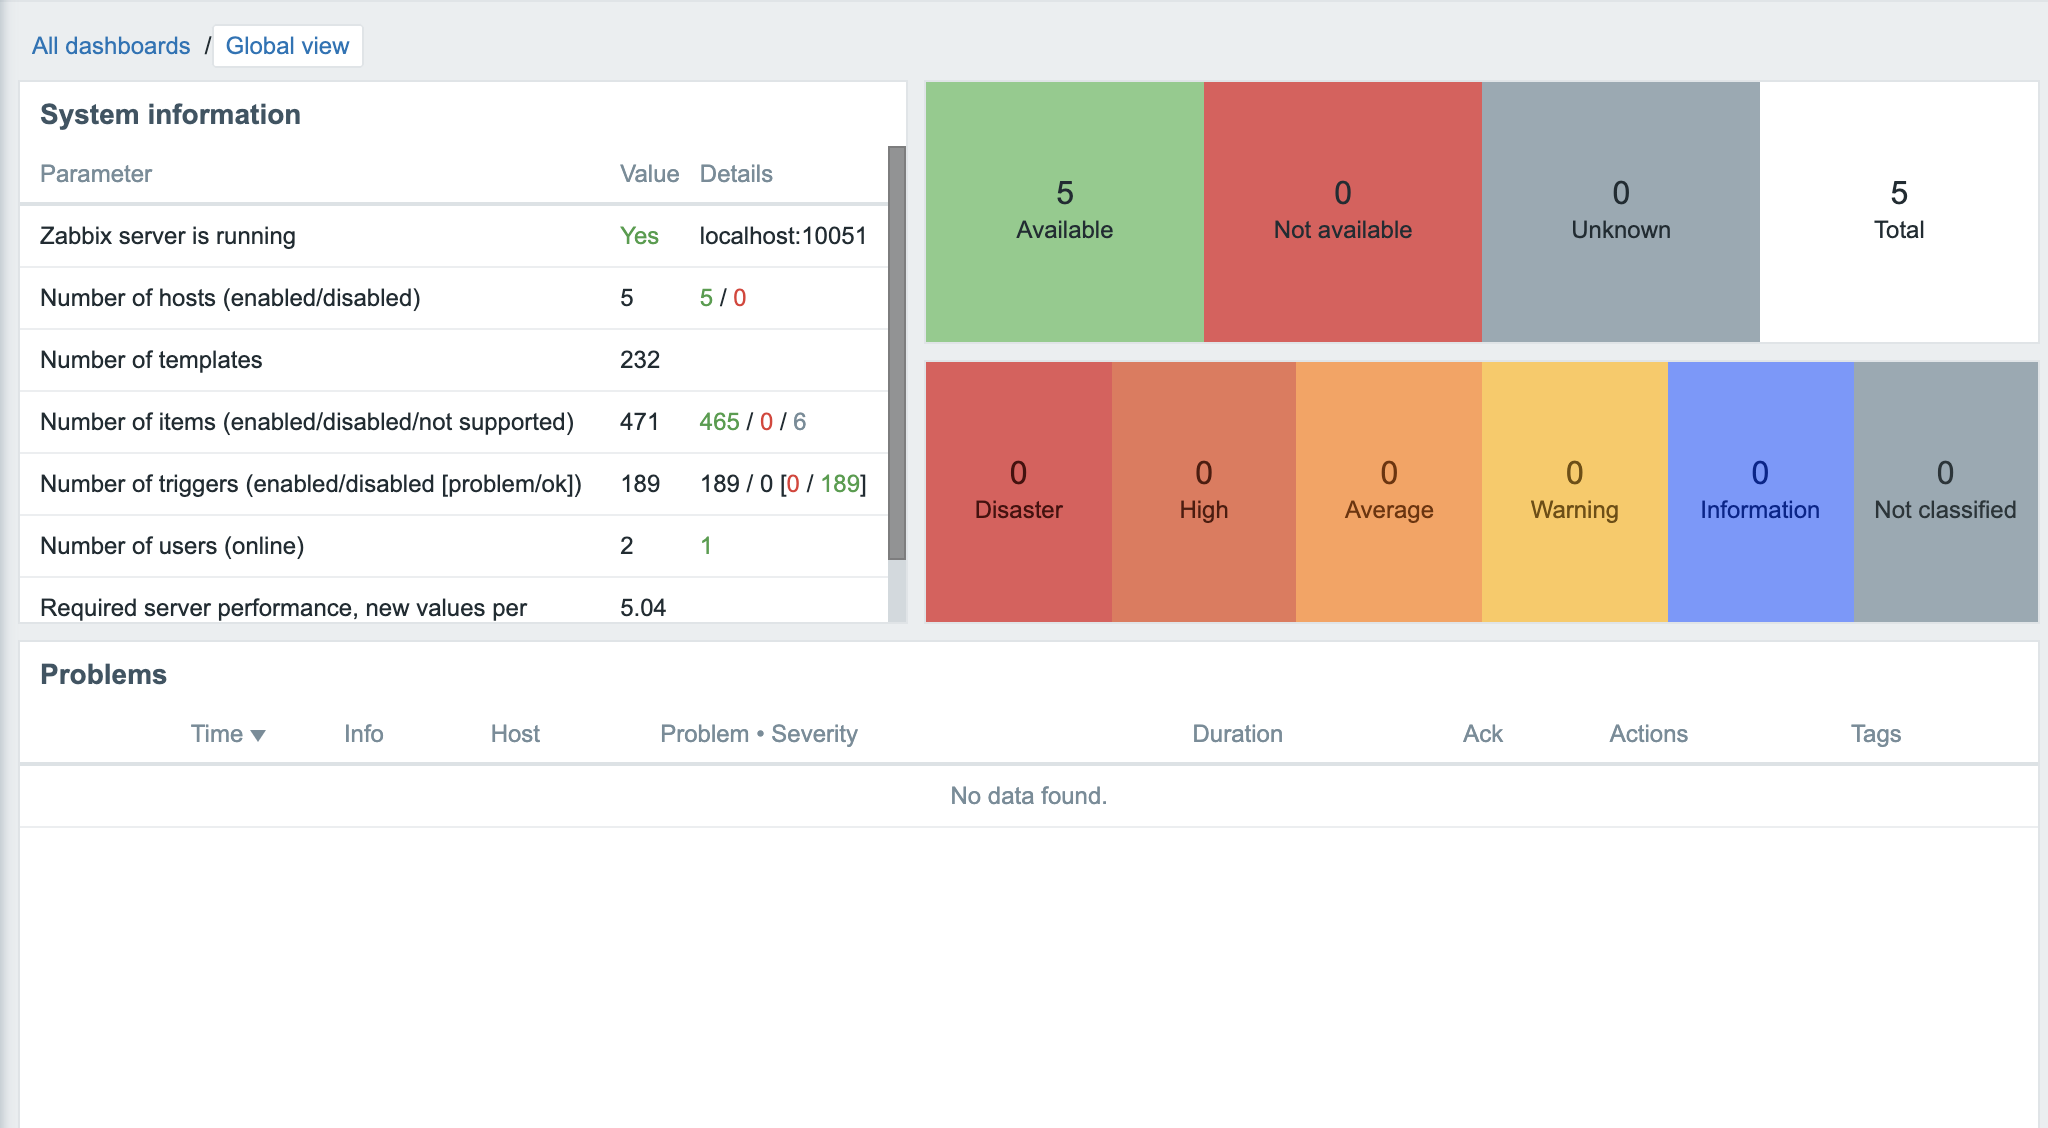
Read more about the installation process here. You will be provided with some pre installation steps and a new Zabbix dashboard. Here's what the dashboard looks like:
Setting up Zabbix agent
Add this onto a different server to be monitored.
- Disable SELinux in this file-
/etc/selinux/config*to get started and install the Zabbix agent using the code given below:
dnf install https://repo.zabbix.com/zabbix/4.4/rhel/8/x86_64/zabbix-release-4.4-1.el8.noarch.rpm
You can change the versions as per your requirement.
Next, configure Zabbix agent on your system using the code in the segment below and edit
/etc/zabbix/zabbix_agentd.confto add:Server=[zabbix server ip] Hostname=[ Hostname of client system ]Next, configure the Firewall for added security using the code given below:
firewall-cmd --permanent --add-port=10050/tcp
firewall-cmd --reload
To complete the installation process, start the Zabbix Agent using the snippet provided below for your reference:
systemctl enable zabbix-agent
systemctl start zabbix-agent
Add Host to Zabbix Web UI
- Go to Configuration -> Hosts -> Create Hosts section and fill in the required details in the screen that appears. Here's an image for your reference:

- The host name can be of your choice and it helps if groups can be run on Linux Servers. The interfaces will have details of where the Zabbix Agent is running. Add in Description of your choice in the portal that appears and select the following in the templates tab:

- If you have successfully integrated the host, you'll come across the following indication:

Create items and triggers
There are some initial items and triggers which are already pre-set to monitor the basic system performance of the CPU, memory etc.
Select a host and move to Items tab and select Create Item.
Next, using a general key from the list of options provided and edit
net.tcp.service[service,<ip>,<port>]to check if the service is running and accepting TCP connections. If the result returns0 -, it means that the service is down and if it returns1 -, it indicates that the service is running.Next, select
ApplicationasStatus. Refer to the following image:

- Now move to the Triggers tab and create a trigger to customise your own. The Expression Constructor which appears will provide help in creating the condition for the alert to be triggered. One can set the
Severityas per the severity of the issue when the alert has to be triggered.Refer to the image given below:

- In this case, the alert will be triggered when the Zabbix agent finds the last value of the Jenkins status set to zero. The alerts that appear on the dashboard will look like this:

Add Slack integration for alerts
Getting alerts on the dashboard only is not enough. So let us configure Zabbix to get alerts on Slack.
- Go to Administration -> Media Types -> Slack on your portal to get started. The most important thing here is setting of the bot token for which we will configure a new app on the Slack workspace.
- Go ahead and start creating your app here by add the following details after selecting the Create App From Scratch option. Here's an image for your reference:

Go to the OAuth & Permissions tab to give scope of
chat:writeto the bot so that it can write to the Slack workspace and install the to add the bot to the required channel.Next, copy the bot user's
OAuthtoken from the same OAuth & Permissions tab and copy it to the Slack media type configuration on Zabbix UI. Next select all the message templates that will be used for the messages to be sent on Slack in the Message Templates tab.The next step is to test the integration; Zabbix will help you set the parameters for testing. To implement this, enter the URL of the server in
zabbix_url.If the test succeeds, the following message will appear in the channel where the bot was added:

You can remove the hard coded value of
zabbix_urland reset the value to{$ZABBIX.URL}and set global macros for by going to the administration tab and clicking on general. Select macros from the dropdown menu and set{$ZABBIX.URL} = <Your Zabbix URL>and click on update from the options provided.Now go to administration on the tab and click on users. Select a user, in my case I chose Admin to go through with the process. After this, select the media tab, click on sdd and fill in the Slack details after selecting it from dropdown.

- Also ensure that the following is enabled by going to the configurations and checking its actions:

Now, Slack will start to receive alerts from Zabbix!
Comparison with Nagios
Nagios is also a very popular server monitoring tool. So let us have a comparison of the same on the based on their server monitoring capabilities:
The installation entire Zabbix infrastructure is comparatively easier.
Zabbix has better data representation in terms of graphs etc. as compared to Nagios.
The issues are not automatically resolved in the Zabbix tool. However, Nagios can do this on its own.
Conclusion
Choosing a server monitoring tool is quite hard and this choice is completely based on the user's choice and the use case of the program. However, I have used more of Zabbix for my coding purposes as I find it really handy and useful when it comes to server monitoring. It is surely a great tool and I implore you to try it once to explore its benefits. I hope this article helps you in the same!
Thank you !! ☺️☺️